Cribl’s internal metrics are very handy for seeing what Cribl is doing. And while there are many data points related to input vs output volumes, sometimes you need more control over what you’re tracking. This pack allows you to route arbitrarily defined traffic through a stats tracker to capture changes in event count and volume. Perhaps you are onboarding a new host, or trialing a new Pipeline. With this pack, you can isolate just the traffic you want to compare, get reduction stats live from the stream, and optionally archive the data for long-term analysis.
This post will walk you through the setup and use of the Cribl Redux Stats Pack.
NOTE: Using this Pack imparts a performance hit. The process of getting the size of every object in an event is not trivial. We do not recommend enabling globally without careful testing and planning.
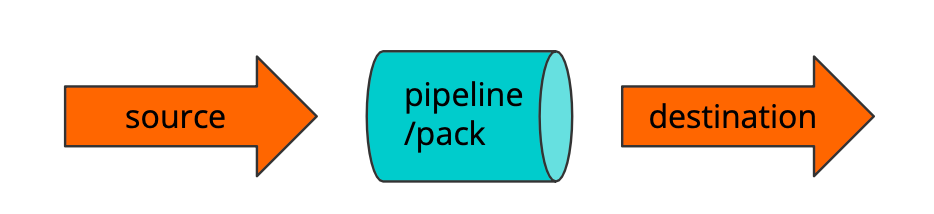
Overview of Event Flow
This is a typical flow through Cribl for events. Events come in, you send them to a Pipeline or Pack, and they get delivered to a destination:
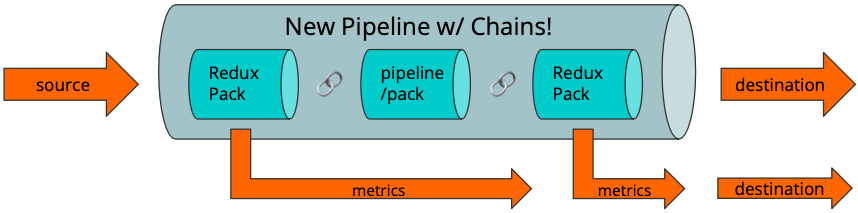
With the Redux Stats Pack (RSP) in place, we sandwich the original Pipeline between 2 calls to the RSP. The Chain function is the easiest way to do this. Metrics from the RSP run will be sent to the destination, along with the pipeline-modified event stream. In pictures:
Install and Configure RSP
First, you’ll need to install the Pack. You can visit packs.cribl.io directly to download the pack file, and then upload it in the Packs interface, or you can use the Dispensary option in the Packs interface.
After installation, there are a few options to address in the RSP before you put it in service.
- If required, set the index appropriately for the 2 Aggregation functions in the RSP
- Decide if you want a metrics format, or just a standard event with structured (K=V, JSON, etc) data
- Decide what dimension(s) (group by) you want to use. The default is sourcetype.
IMPORTANT: The dimensions you use must stay the same throughout the process
Create the Chaining Pipeline
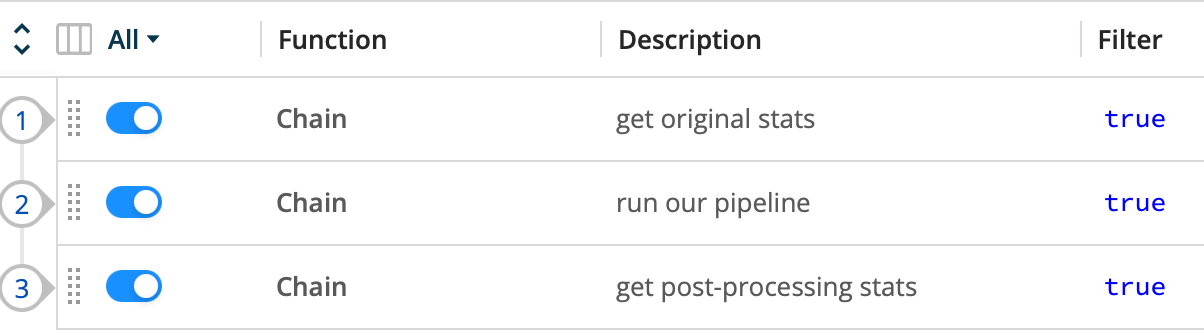
The Chain function allows you to call one Pipeline, or Pack, from within another, allowing you to treat a Pipeline as a function of sorts. Once the Chained function completes, the event continues down the rest of the Pipeline that called it. (If you flag a function as Final in the Chained Pipeline, the event will short-circuit out, falling through to the destination.)
With this in mind, create a new Pipeline called redux-stats or similar. Add 3 Chain functions. The first points to the RSP. The second points to the original Pipeline or Pack. The last points back to the RSP.
Update the Route
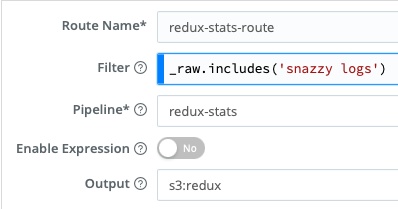
Updating the Data Route table is the final step. Create a new Route, with a filter that matches the data you want to measure. The Filter can match on any part of the event you want. In the example here, I’m looking in the _raw content for the string snazzy logs . See our docs for more info re: Filter Expressions. The advantage of using the RSP is you can use this filter to analyze any subset of data you want.
Point it to the new redux-stats Pipeline you created above, and to your destination.
That’s it. Commit & Deploy, and you should be rolling!
Sample Metrics Output
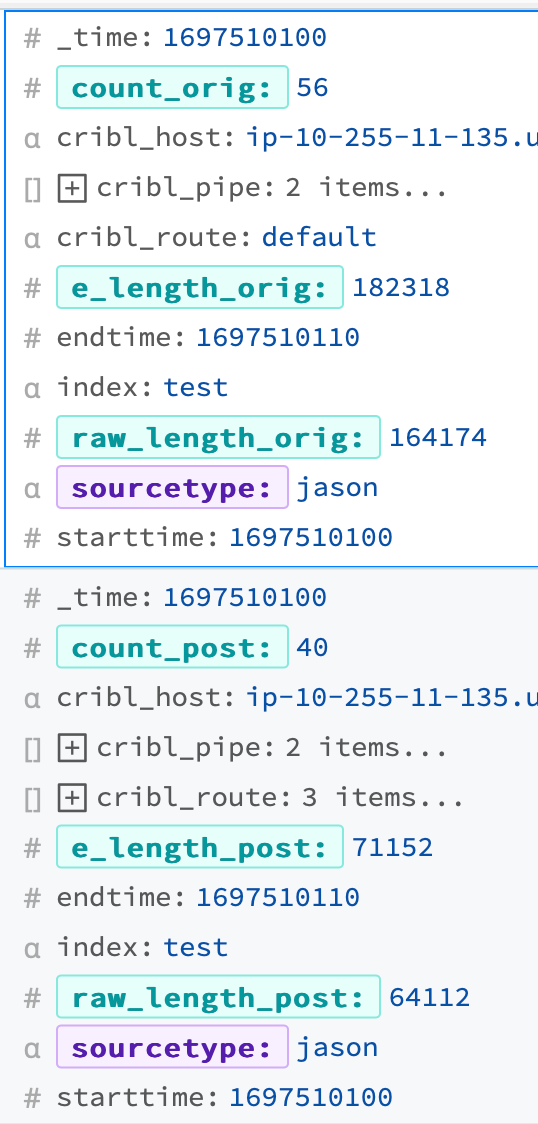
You can capture the event metrics pretty easily in Cribl Stream directly. Use a filter of __redux_next == 'index' && endtime && starttime , and capture at stage 4 (before the destination). The output below shows 16 events were dropped, and about 110kb out of 180kb in a 10-second window. Of course, you can also dump them into your favorite search tool and run aggregated reports on the stats.
Other Options
Output Router
The Output Router is one of Cribl’s unsung heroes. It allows you to perform routing decisions as you do in the Data Routes table, but just before the destination. Last chance routing! With an OR, you can decide where to deliver the event and the metrics independently.
The specifics are outside of scope, but the quick version is to create and validate the 2 destinations. Then create a 3rd, using the Output Router. In the OR destination, set the criteria for each event type to their appropriate destination(s). Finally, change your Route or Quick Connect to point to the OR destination.
Metrics Only
There is no requirement to keep the original event stream. Maybe you only care about getting the stats. Open up the redux Pipeline within the pack. Then open the 2nd Aggregation – the one with filter __redux_next === ‘post’. Under Output Settings, uncheck Passthrough Mode, save, commit & deploy. Since this is the 2nd aggregation, once we get the stats we want, we’ll drop the original event stream.
Conclusion
Cribl’s built-in metrics are great. By using Cribl’s functions you can take metrics collection to another level, giving you pinpoint control and insight into your o11y pipeline efficiencies.
One More Thing
The raw stats events are interesting, and you may have your own log analysis tool to generate a report. The good news is that Cribl has one too. If you log the metrics into an object store, Cribl Search can report on your reduction metrics easily.
One way to accomplish this would be to use the Output Router: Set up an OR pointing your original event stream to your desired destination. Send all the metrics events (filter __redux_next == 'index' && endtime && starttime) to S3.
However you get the data to the object store, the next step would be to jump into Search. If this is your first time in Search you’ll want to hit up our docs first. Short version: Create a Dataset Provider (Data → Dataset Provider). This defines the overall connection to a source of data. Then create a Dataset. This defines more specifically where the data is in the Dataset Provider, what it looks like, etc. Once you have the Dataset defined you can search. Here’s one example that I used to get aggregated event counts, and event sizes:
dataset="reduxstats" starttime>0

| summarize co=sum(count_orig),

cp=sum(count_post),

elo=sum(e_length_orig),

elp=sum(e_length_post)

by sourcetype

| extend count_redux=round(100*(cp-co)/co,2) + "%",

size_redux=round(100*(elp-elo)/elo,2) + "%"

| project-away el*, cp, co

| render table
And the results:
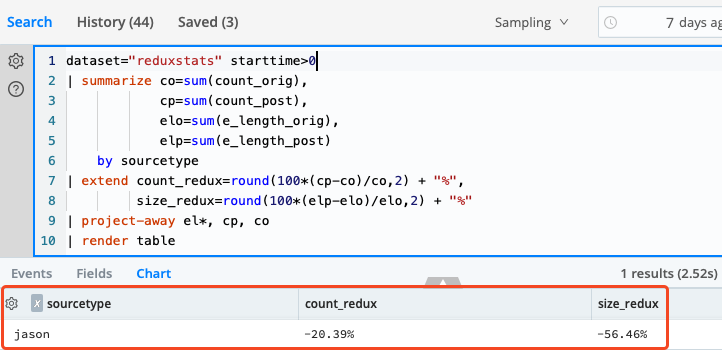
Beautiful! Cribl Search makes it so easy. No indexing is required!
Use the ? icon on the left side of the search box to explore the available search terms. Here’s a brief explainer of this report:
- We are searching data contained in the reduxstats dataset that contains a starttime field with a positive value. You can specify multiple datasets, and you can even wild card them, making it easy to search multiple datasets.
- We summarize (or aggregate) the before and after data by sourcetype. The = notation allows for naming the fields.
- We add more columns to the resulting data with the extend command. In this case we’re figuring the % delta in count and event size.
- We drop the fields we’re not interested in from appearing in the final report. Wildcards are supported here too.
- Finally, we render the data in a table.
Cribl Search supports dashboarding, scheduled searches, and injecting the resulting data back into your pipeline, among many other features. Check it out!
Cribl, the Data Engine for IT and Security, empowers organizations to transform their data strategy. Customers use Cribl’s suite of products to collect, process, route, and analyze all IT and security data, delivering the flexibility, choice, and control required to adapt to their ever-changing needs.
We offer free training, certifications, and a free tier across our products. Our community Slack features Cribl engineers, partners, and customers who can answer your questions as you get started and continue to build and evolve. We also offer a variety of hands-on Sandboxes for those interested in how companies globally leverage our products for their data challenges.