When you’re using Cribl Stream and Cribl Edge to send data to hundreds of Splunk indexers using Load Balancing-enabed Destinations, it is sometimes necessary to analyze memory usage. In this blog post, we delve into buffer management, memory usage calculations, and mitigation strategies to help you optimize your configuration and avoid memory issues.
This post is valid for SplunkLB Destinations, as well as any other Load Balancing-enabled Destination supported by Stream/Edge (with which we do not interface using a third-party library like AWS, Azure, and Kafka). So the complete destination list to which this post applies as of publishing is SplunkLB, TCP syslog, TCP JSON, and Cribl TCP. However, in our experience, users don’t have hundreds of targets for any of those Destinations except SplunkLB, so I’ll only reference SplunkLB for brevity.
Previous Reading
This post builds upon a previous blog post, Understanding SplunkLB Intricacies, but you can jump right in to learn how to use Stream efficiently with large numbers of Splunk indexers. In Understanding SplunkLB Intricacies, we discussed the various buffers that each Sender uses inside a SplunkLB Destination and how Stream reacts to backpressure from LB-destinations. This post digs into analyzing memory usage that is sometimes necessary to perform in Cribl Stream/Edge environments when sending to hundreds of Splunk indexers.
Check out that post first if you want more context into the load balancing design of the SplunkLB Destination, how the buffers are used, and why there are so many of them.
It also includes diagrams that depict where in the flow those buffers reside, that aren’t in this post.
The Background: Buffers and Memory Impact
There are two types of buffers that we’ll cover here: in-progress buffers and transit buffers. Up to two of each can exist simultaneously but, at most, only up to three (two transits and one in-progress) buffers actively store events at any point in time.
When the fourth buffer is necessary, it will be waiting on hot standby and, therefore always allocated in memory. For simplicity, we call it the fourth buffer but it won’t always be the same buffer. The two in-progress buffers are swapped back and forth between being used (that is, being filled with events) and unused.
At lower throughput, SplunkLB Senders for a Worker Process won’t get much backpressure from indexers, so Stream may get by with just two buffers allocated: one in-progress and one transit buffer. Two is the absolute minimum.
At higher throughputs, and in combination with network issues or when Splunk indexers are delaying receipt of TCP packets from Stream, Senders may need two of each buffer type in order to simply have more buffering capacity to absorb backpressure effects. Ultimately, this means you can expect that for a given worker process, 2-4MB of buffer memory will be allocated per indexer connection.
The Math is Mathing
So, what does this memory usage look like at the next level up from Sender at the Worker Process level? Let’s go over a few examples with low and high numbers of indexers, and the calculations that determine the memory usage.
Example: One SplunkLB Destination with 100 Indexers
Let’s say you created a SplunkLB Destination with 100 indexers (manually configured or using indexer discovery). Each Process will, by default, connect to each of those 100 indexers and will at least allocate 2MB total for two buffers. If necessary, up to two more buffers (2 MB more) will be allocated as data begins flowing.
This results in 200 MB – 400 MB of external memory being dedicated for this example SplunkLB Destination on a per Process basis, and this is in addition to the heap memory usable by each Process, which defaults to a maximum of 2GB (which is allocated only as needed).
If you have multiple SplunkLB Destinations configured, additional memory will be used for each of those. For more information about what external memory is and how it relates to heap memory, see this external page.
Example: High Memory Usage
We have customers that have up to 300 indexers defined in a single SplunkLB Destination and then have two or more SplunkLB Destinations that have many of the same indexers defined. That’s on the high end for indexer count, so I’ll use it as an obvious example of high memory usage.
Since Stream treats each SplunkLB Destination as independent, each Process in that customer environment will connect to some indexers multiple times, because that’s what their configuration specifies. This results in a lot of memory usage just for Destination-related buffers.
Here is an example of a log event from a system that possesses a configuration that uses 1300 indexers across multiple SplunkLB destinations (just over 300 indexers reused across 4 destinations) and was reported to Cribl Support as having memory issues due to the host running out of memory. Note the large amount of external memory resulting from the 1300 indexers. The Worker Node this event came from is currently having processes crash on it because the full amount of necessary memory couldn’t be allocated because the host had insufficient memory to accommodate all processes and their needs.
{"time":"2023-12-10T16:44:07.012Z","cid":"w15","channel":"server","level":"info","message":"_raw stats","inEvents":191915,"outEvents":345407,"inBytes":140474707,"outBytes":223893933,"starttime":1702226581,"endtime":1702226638,"activeCxn":0,"openCxn":392,"closeCxn":392,"rejectCxn":0,"abortCxn":0,"pqInEvents":43891,"pqOutEvents":3664,"pqInBytes":25447295,"pqOutBytes":2383397,"droppedEvents":54570,"tasksStarted":0,"tasksCompleted":0,"pqTotalBytes":869425152,"pqBufferedEvents":0,"activeEP":7,"blockedEP":0,"cpuPerc":74.24,"eluPerc":60.49,"mem":{"heap":345,"ext":2634,"rss":3707}}
In addition, this scenario of duplicative indexers across destinations also causes a non-trivial amount of memory that is, in a sense, redundant. While using the same indexers across multiple destinations is sometimes unavoidable, it can create significant redundant memory usage. If your Processes consume hundreds of megabytes of external memory, review your SplunkLB configurations to see if this might be the cause.
Since the memory segment used by these buffers is external rather than heap, there isn’t a setting to control the memory limit. There are ways to make the configuration more efficient – we’ll discuss those in the section below. If the configuration can’t be made more efficient to help control memory usage, ensure the Stream hosts have sufficient memory for Worker Processes to request as necessary if hundreds of Splunk indexer connections are being established per Process.
Mitigating Application Memory Use
There are two ways to ensure the application uses less memory for SplunkLB Destinations with hundreds of indexer connections:
- Try to condense the LB-enabled destinations you have configured. Additionally, avoid specifying the same target names/IPs in multiple Destinations since Stream will establish connections to them that will ultimately be redundant.
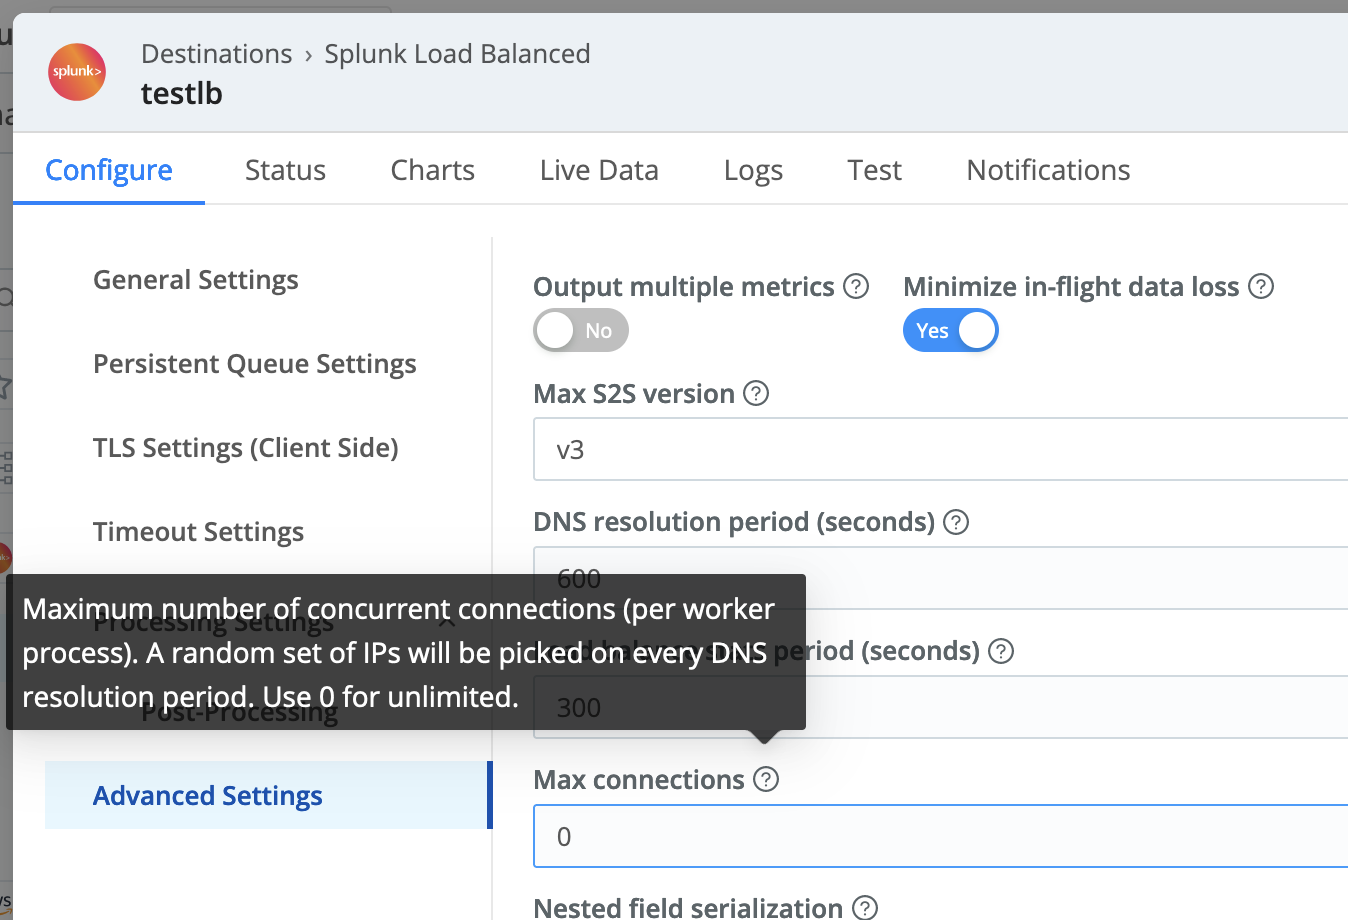
- Leverage the setting Cribl Stream introduced a couple of years ago called Max Connections. This is in each SplunkLB Destination’s settings, enabling you to specify the exact number of indexers you want Stream Processes to connect to at any given moment. Stream will still cycle through all your indexers over time, but at any given moment, it will only connect to a random subset of your indexers within a SplunkLB Destination. The default value of 0 will use the behavior before the setting is made available, which dictates connecting to all defined/discovered indexers. The connections will cycle at the frequency specified by the DNS Resolution Period. The lower the value, the fewer connections are established and, thus, a smaller memory footprint.
If the changes above can’t be applied, the worst-case scenario is that your Stream/Edge Nodes will need more RAM allocated. This makes RAM available when Worker Processes need it.
Putting It All Together
We’ve discussed just one aspect of your Stream configuration that can consume a large amount of memory, which can potentially be the largest part of the overall memory footprint of each Worker Process. Because the section of memory used by these buffers cannot be limited, you must take appropriate steps when configuring Stream to minimize memory usage. I hope this helps provide insight into better managing memory consumed by your LB-enabled destinations!
Cribl, the Data Engine for IT and Security, empowers organizations to transform their data strategy. Customers use Cribl’s suite of products to collect, process, route, and analyze all IT and security data, delivering the flexibility, choice, and control required to adapt to their ever-changing needs.
We offer free training, certifications, and a free tier across our products. Our community Slack features Cribl engineers, partners, and customers who can answer your questions as you get started and continue to build and evolve. We also offer a variety of hands-on Sandboxes for those interested in how companies globally leverage our products for their data challenges.