We’ve all been there, cursing the “network” when a service fails to load as expected. Even with my 1.5Gbps fiber connection, there are many reasons why the “network” can be blamed. And, yes, I intentionally put the word network in quotes because the network is more than the speed of the network link. When we talk about the slow network, it could be local wireless issues, network latency or path problems, a variety of DNS issues, TCP port(s) being inaccessible, or something within the service itself. To say that it is the “network” is a broad statement covering network bandwidth, congestion, DNS, and applications like NTP that we don’t often consider.
In this article, I will show you how to use Cribl Edge plus a handy shell script to automatically detect the DNS and NTP servers in use, generate performance statistics, store the data in Cribl Lake, and visualize it using Cribl Search.
Answering “Is It the Network?” Like a Network Engineer
Once upon a time, I asked a network engineer, “When you are troubleshooting a network issue, what do you do to get the data you need?” The answer was complex and nuanced, fitting the complexity and nuances inherent with running a large-scale network. Imagine my delight when I learned that part of their answer had been explored by the CEO of Cribl, Clint Sharp, back in early 2020 with a blog post long before I had even posed my question!
Here is a list of items that this network engineer said they would need to begin to troubleshoot a network problem accurately:
- What are the source and destination of the connection?
- Is the destination IP reachable? Is it always accessible?
- Is the destination port open? Is it always accessible?
- When did the problem start?
- What changed? (Configuration, new deployments, etc.)
- What is the latency from source to destination? Is it different now vs “normal”?
- What is the path from source to destination? Is it different now vs “normal”?
This is just the start of troubleshooting connectivity and stability issues. A “slow network” or “cannot connect to a service” complaint could be a storage issue (yep, I’ve seen that one), an SSL handshake issue (I’ve seen that one, too), or the result of a “small” change that “nobody will even notice.”

While Cribl Edge is not a network monitoring tool, we do have integrations with packet capture platforms like Gigamon. However, I am using Cribl Edge to execute commands on a local machine, returning the telemetry for processing just as you would other logs or metrics.
What Does It Look Like?
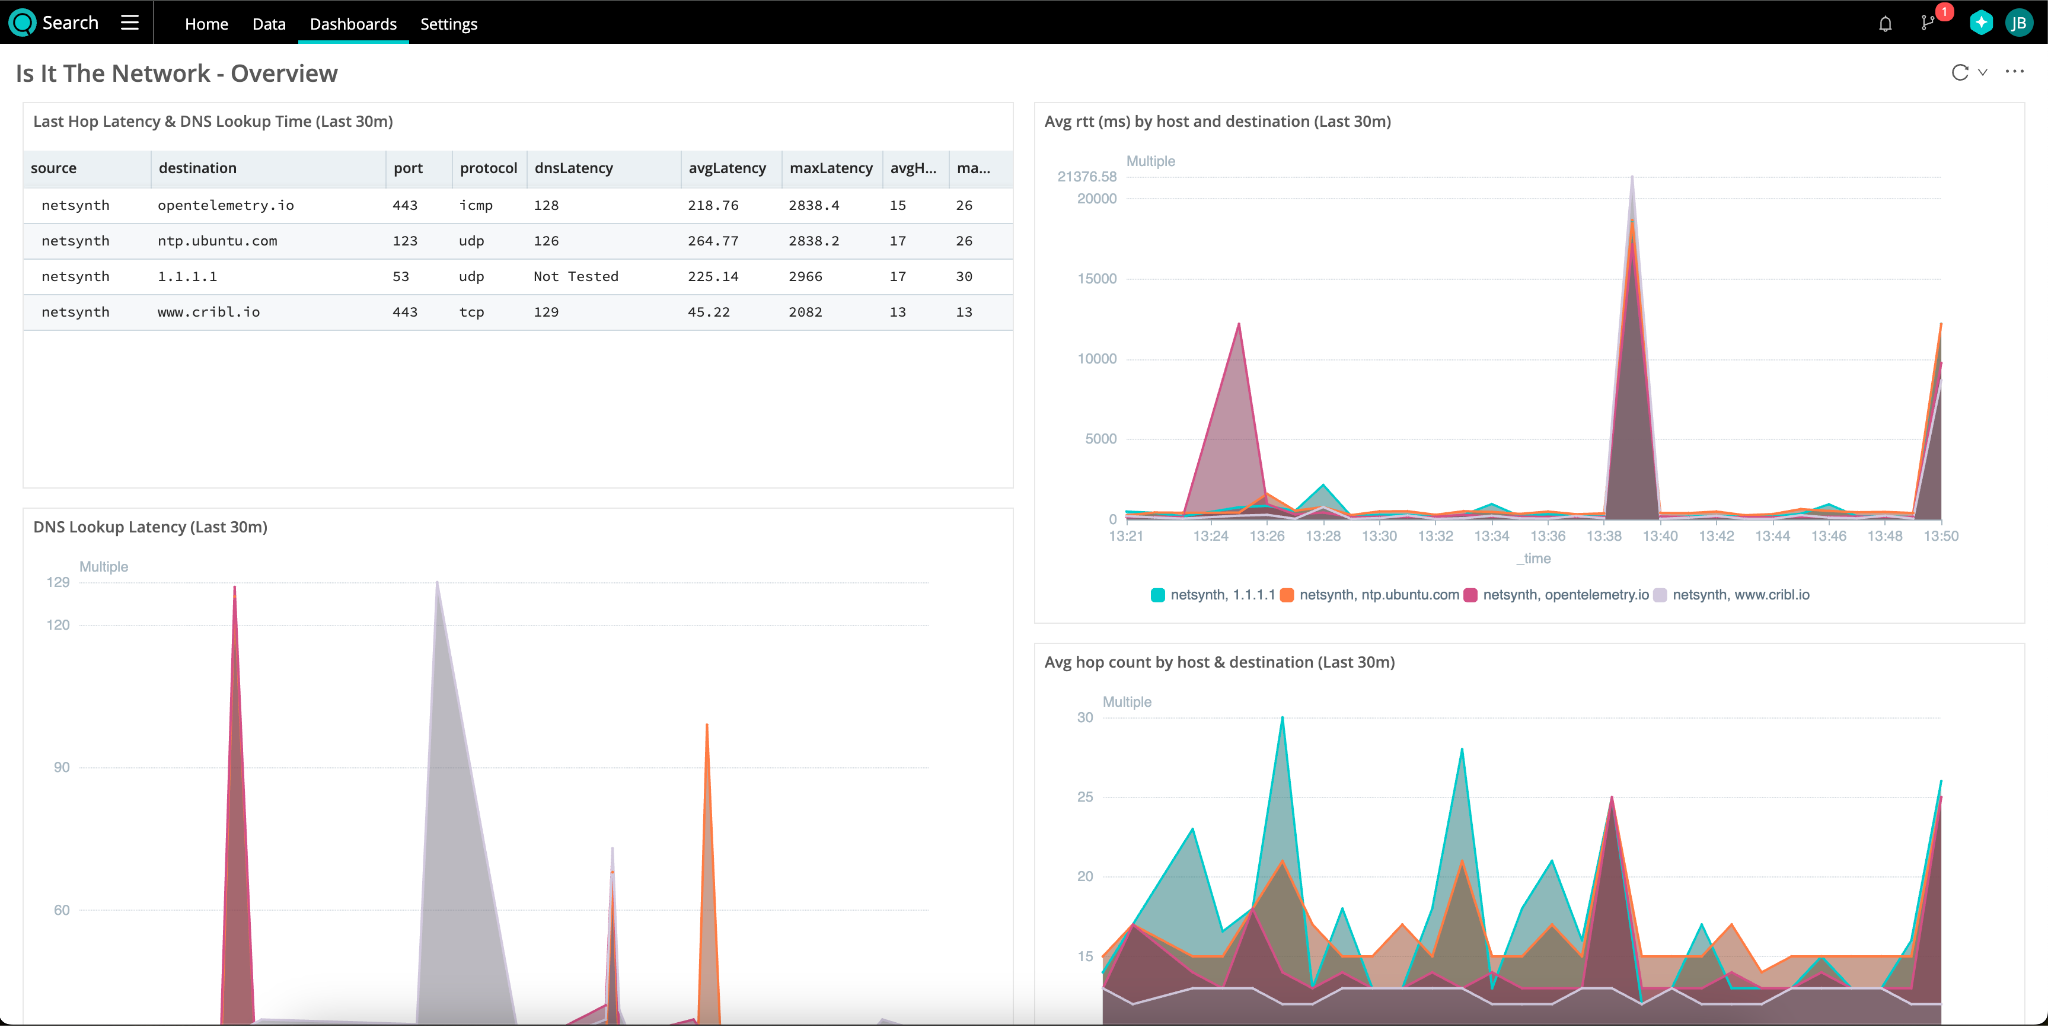
While mtr gives detailed, hop-by-hop metrics that I’ve stored in Lake, the dashboard focuses on just the key pieces of information. Remember, when the network is the suspect, the questions to answer are – Can we find the address? Can we reach it? How long does it take? Is it normal?
In the dashboard, we expose the DNS lookup latency, the network latency, and the number of hops. The other graphs give us insights into the changes in those same metrics over time to answer the final question – Is it normal?
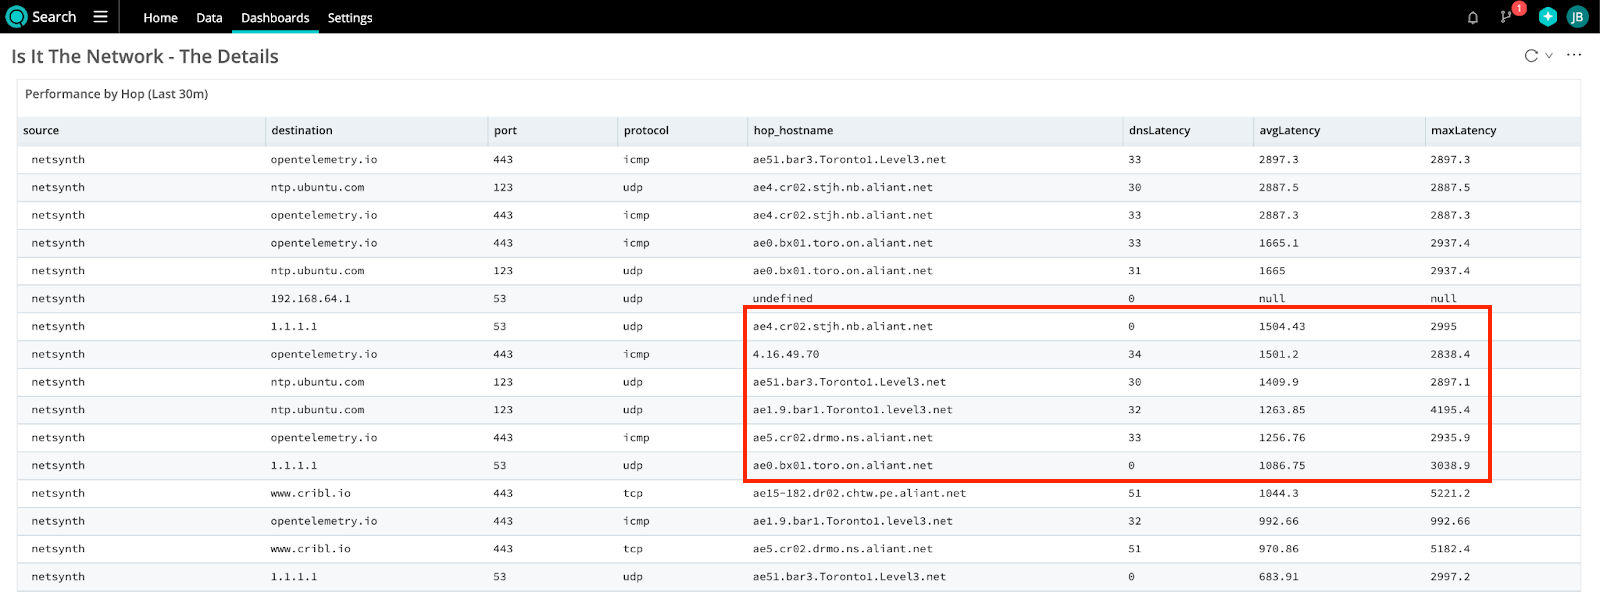
Digging Into the Details
Because we have the right data in the right place, we can build a view using a common data set to dig into the details about “where” there are problems in the network path. Is the latency coming from within our network, or is it something external? Looking at the table below, a Level3 node and 2 Bell Aliant nodes, 1 in Ontario and 1 in New Brunswick, have the highest latency.
The good news? It’s not my network!
The bad news? The problem is in a network that I cannot change.
Build Your Own Implementation
The meat of this data set is a bash script I cobbled together that writes a JSON file to /tmp on a Linux machine. I used crontab to schedule the script to run every 60 seconds and then used the File Monitor Source in Edge to ingest the JSON files. Don’t forget to set the event breaker to No Break for this dataset, to capture the complete JSON.
The script takes up to 4 parameters – target (IP or DNS name), port, protocol (defaults to icmp), and an –exclude-local flag. You can see some examples of how I used them below. The NTP and DNS flags are shorthand for “Discover the NTP and DNS servers I am using and test them too!” The DNS latency metrics use the same logic of discovering the primary DNS server to use for query latency.
* * * * * /opt/netcheck/netcheckv5.sh www.cribl.io 443 tcp

* * * * * /opt/netcheck/netcheckv5.sh ntp --exclude-local

* * * * * /opt/netcheck/netcheckv5.sh dns --exclude-local

* * * * * /opt/netcheck/netcheckv5.sh opentelemetry.io 443
The mtr Script
#!/bin/bash

# Function to get the NTP server from the system configuration

# @return The NTP server name

get_ntp_server() {

# Check if timedatectl is installed and can retrieve the NTP server

if command -v timedatectl &> /dev/null; then

ntp_server=$(timedatectl show-timesync --all | grep "^ServerName=" | cut -d= -f2)

fi

# If timedatectl fails, try extracting from ntpq

if [ -z "$ntp_server" ]; then

if command -v ntpq &> /dev/null; then

ntp_server=$(ntpq -pn | awk 'NR==3 {print $1}')

fi

fi

# If ntpq fails, try extracting from chrony config

if [ -z "$ntp_server" ]; then

if [ -f /etc/chrony/chrony.conf ]; then

ntp_server=$(grep -m 1 "^server" /etc/chrony/chrony.conf | awk '{print $2}')

fi

fi

# If chrony.conf fails, try extracting from systemd-timesyncd

if [ -z "$ntp_server" ]; then

if [ -f /etc/systemd/timesyncd.conf ]; then

ntp_server=$(grep -m 1 "^NTP=" /etc/systemd/timesyncd.conf | cut -d= -f2)

fi

fi

# If all methods fail, set a reliable default NTP server

if [ -z "$ntp_server" ]; then

ntp_server="time.google.com"

fi


echo "$ntp_server"

}

# Function to get the DNS servers from resolvectl

# @return The DNS server addresses

# Get the DNS servers from the system configuration.

#

# This function checks if the `resolvectl` command is available and can retrieve the DNS servers.

# If `resolvectl` is available, it uses it to get the DNS servers from the system configuration.

# If `resolvectl` is not available or fails, it sets a default DNS server of "8.8.8.8".

#

# @return The DNS servers as a string, separated by spaces.

get_dns_servers() {

if command -v resolvectl &> /dev/null; then

dns_servers=$(resolvectl status | grep "DNS Servers" | awk '{print $3}')

fi

# If resolvectl is not available or fails, set a default DNS server

if [ -z "$dns_servers" ]; then

dns_servers="8.8.8.8"

fi

echo "$dns_servers"

}

# Function to get local subnets

# @return The local subnets

get_local_subnets() {

ip address | grep 'inet ' | awk '{print $2}'

}

# Function to check if an IP is in the same subnet

# @param ip The IP address to check

# @param subnets The subnets to check against

# @return true if the IP is in the same subnet, false otherwise

is_same_subnet() {

local ip="$1"

local subnets="$2"

for subnet in $subnets; do

if ipcalc -n "$ip" "$subnet" &>/dev/null; then

return 0

fi

done

return 1

}

# Function to measure DNS lookup latency

# @param dns_server The DNS server to query

# @param target The target domain name

# @return The DNS lookup latency in milliseconds

measure_dns_latency() {

local dns_server="$1"

local target="$2"

local dns_latency

dns_latency=$(dig @"$dns_server" "$target" +stats +noadditional +noquestion +nocomments +nocmd | grep "Query time:" | awk '{print $4}')

echo "$dns_latency"

}

# Generate a unique test ID

test_id=$(uuidgen)

# Parse command line arguments

EXCLUDE_LOCAL=false

while [[ "$1" == --* ]]; do

case "$1" in

--exclude-local)

EXCLUDE_LOCAL=true

shift

;;

*)

echo "Unknown option $1"

exit 1

;;

esac

done

# Determine the target, port, and protocol

case "$1" in

NTP|ntp)

target=$(get_ntp_server)

port=123

protocol="udp"

;;

DNS|dns)

target=$(get_dns_servers)

port=53

protocol="udp"

;;

*)

target="$1"

port="${2:-80}" # Default to port 80 if not provided

protocol="${3:-icmp}" # Default to ICMP if not provided

;;

esac

# Exclude local subnets if --exclude-local is set

if $EXCLUDE_LOCAL; then

local_subnets=$(get_local_subnets)

filtered_targets=""

for single_target in $target; do

if ! is_same_subnet "$single_target" "$local_subnets"; then

filtered_targets+="$single_target "

fi

done

target=$filtered_targets

fi

# Iterate over each target if multiple

for single_target in $target; do

dns_latency=0

# Measure DNS lookup latency if the target is a DNS name

if [[ "$single_target" =~ ^[a-zA-Z] ]]; then

dns_servers=$(get_dns_servers)

for dns_server in $dns_servers; do

dns_latency=$(measure_dns_latency "$dns_server" "$single_target")

if [ -n "$dns_latency" ]; then

break

fi

done

fi

# Capture mtr output with error handling

if [ "$protocol" = "tcp" ]; then

mtr_output=$(mtr -j -c 3 -G 2 -P "$port" --tcp -o "LDRSNBAWG" "$single_target")

elif [ "$protocol" = "udp" ]; then

mtr_output=$(mtr -j -c 3 -G 2 -P "$port" --udp -o "LDRSNBAWG" "$single_target")

else

mtr_output=$(mtr -j -c 3 -G 2 -o "LDRSNBAWG" "$single_target")

fi

# Check if mtr command was successful

if [ $? -ne 0 ]; then

echo "mtr command failed for target $single_target"

continue

fi

# Modify the mtr output with jq and test ID

modified_output=$(echo "$mtr_output" | jq --arg tid "$test_id" --arg port "$port" --arg proto "$protocol" --arg dns_latency "$dns_latency" '.report.mtr += {testId: $tid, port: $port, protocol: $proto, dnsLatency: $dns_latency}')

# Create the filename with target, port, and test ID

filename=$(printf '%q' "/tmp/${single_target}-${protocol}-${port}-${test_id}.json")

# Delete older files if there are more than 5

file_count=$(ls -l /tmp/${single_target}-${protocol}-${port}-*.json 2>/dev/null | wc -l)

if [ "$file_count" -gt 5 ]; then

ls -t /tmp/${single_target}-${protocol}-${port}-*.json | tail -n +6 | xargs rm --

fi

# Write the modified output to the JSON file

echo "$modified_output" > "$filename"

done
The Pipeline in Edge
{

"id": "edge-mtr-to-metrics",

"conf": {

"output": "default",

"streamtags": [],

"groups": {},

"asyncFuncTimeout": 1000,

"functions": [

{

"id": "serde",

"filter": "true",

"disabled": false,

"conf": {

"mode": "extract",

"type": "json",

"srcField": "_raw",

"remove": []

},

"description": "Parse _raw into report object"

},

{

"filter": "true",

"conf": {

"add": [

{

"disabled": false,

"name": "mtr_hopsTotal",

"value": "JSON.stringify(report.hubs).match(/\\{[^{}]+\\}/g).length"

},

{

"disabled": false,

"name": "mtr_testId",

"value": "report.mtr.testId"

},

{

"disabled": false,

"name": "mtr_dst",

"value": "report.mtr.dst"

},

{

"disabled": false,

"name": "mtr_dstPort",

"value": "report.mtr.port"

},

{

"disabled": false,

"name": "mtr_protocol",

"value": "report.mtr.protocol"

},

{

"disabled": false,

"name": "mtr_pktCount",

"value": "report.mtr.tests"

},

{

"disabled": false,

"name": "mtr_dnsLatency",

"value": "report.mtr.dnsLatency"

}

],

"remove": [

"_raw"

]

},

"id": "eval",

"disabled": false,

"description": "Extract test metadata like DNS latency, source, destination, and extract the total hops"

},

{

"filter": "true",

"conf": {

"srcExpr": "report.hubs",

"dstField": "mtr"

},

"id": "unroll",

"disabled": false,

"description": "Unroll the individual hop test results"

},

{

"filter": "true",

"conf": {

"fields": [

"mtr"

],

"prefix": "",

"depth": 5,

"delimiter": "_"

},

"id": "flatten",

"disabled": false,

"description": "Flatten the individual hop test results, converting them to top-level key:value pairs"

},

{

"id": "rename",

"filter": "true",

"disabled": false,

"conf": {

"wildcardDepth": 5,

"rename": [

{

"currentName": "\"mtr_Loss%\"",

"newName": "lossPct"

},

{

"currentName": "mtr_Avg",

"newName": "rttAvg_ms"

},

{

"currentName": "mtr_Best",

"newName": "rttBest_ms"

},

{

"currentName": "mtr_Drop",

"newName": "pktsDropped"

},

{

"currentName": "mtr_Gmean",

"newName": "rttMean_ms"

},

{

"currentName": "mtr_Javg",

"newName": "jitterAvg_ms"

},

{

"currentName": "mtr_Jmax",

"newName": "jitterMax_ms"

},

{

"currentName": "mtr_Jttr",

"newName": "jitter_ms"

},

{

"currentName": "mtr_Last",

"newName": "jitterLast_ms"

},

{

"currentName": "mtr_LossPct",

"newName": "pktLoss_pct"

},

{

"currentName": "mtr_PktCount",

"newName": "pktCount"

},

{

"currentName": "mtr_Rcv",

"newName": "pktsRcvd"

},

{

"currentName": "mtr_Snt",

"newName": "pktsSent"

},

{

"currentName": "mtr_StDev",

"newName": "rttStDev_ms"

},

{

"currentName": "mtr_Wrst",

"newName": "rttWorst_ms"

},

{

"currentName": "mtr_dnsLatency",

"newName": "dnsLatency_ms"

},

{

"currentName": "mtr_count",

"newName": "mtr_hop"

}

]

}

},

{

"filter": "true",

"conf": {

"overwrite": false,

"dimensions": [

"mtr_host",

"host",

"mtr_dst",

"mtr_dstPort",

"mtr_protocol",

"mtr_hop"

],

"removeMetrics": [],

"removeDimensions": [],

"fields": [

{

"metricType": "gauge",

"inFieldName": "rttAvg_ms"

},

{

"metricType": "gauge",

"inFieldName": "rttBest_ms"

},

{

"metricType": "gauge",

"inFieldName": "pktsDropped"

},

{

"metricType": "gauge",

"inFieldName": "rttMean_ms"

},

{

"metricType": "gauge",

"inFieldName": "jitterAvg_ms"

},

{

"metricType": "gauge",

"inFieldName": "jitterMax_ms"

},

{

"metricType": "gauge",

"inFieldName": "jitter_ms"

},

{

"metricType": "gauge",

"inFieldName": "rttLast_ms"

},

{

"metricType": "gauge",

"inFieldName": "pktLoss_pct"

},

{

"metricType": "gauge",

"inFieldName": "pkts"

},

{

"metricType": "gauge",

"inFieldName": "pktsRcvd"

},

{

"metricType": "gauge",

"inFieldName": "pktsSent"

},

{

"metricType": "gauge",

"inFieldName": "rttStDev_ms"

},

{

"metricType": "gauge",

"inFieldName": "rttWorst_ms"

},

{

"metricType": "gauge",

"inFieldName": "dnsLatency_ms"

},

{

"metricType": "gauge",

"inFieldName": "jitterLast_ms"

},

{

"metricType": "gauge",

"inFieldName": "lossPct"

},

{

"metricType": "gauge",

"inFieldName": "mtr_hopsTotal"

}

]

},

"id": "publish_metrics",

"disabled": false,

"description": "Publish metrics from each hop"

},

{

"filter": "true",

"conf": {

"remove": [

"report",

"cribl_breaker",

"cribl_pipe",

"mtr_Jint"

],

"add": [

{

"disabled": false,

"name": "'system.name'",

"value": "__metadata.os.hostname"

},

{

"disabled": false,

"value": "__metadata.os.arch",

"name": "'system.arch'"

},

{

"disabled": false,

"value": "__metadata.os.os_version",

"name": "'system.os_version'"

},

{

"disabled": false,

"value": "__metadata.os.os_version_id",

"name": "'system.os_version_id'"

},

{

"disabled": false,

"value": "__metadata.os.platform",

"name": "'system.platform'"

},

{

"disabled": false,

"value": "__metadata.os.release",

"name": "'system.release'"

},

{

"disabled": false,

"value": "__metadata.env.CRIBL_SERVICE_NAME",

"name": "'service.name'"

}

]

},

"id": "eval",

"disabled": false,

"description": "Clean up (recommended) & prep top-level attributes for OTLP metrics (optional)"

},

{

"filter": "true",

"conf": {

"resourceAttributePrefixes": [

"service",

"system",

"telemetry",

"k8s",

"cloud",

"host",

"process"

],

"dropNonMetricEvents": false

},

"id": "otlp_metrics",

"disabled": true,

"description": "Publish metrics per hop in OTLP Metrics format"

}

]

}

}
The Dashboard
{

"elements": [

{

"config": {

"onClickAction": {

"type": "None"

},

"colorPalette": 0,

"colorPaletteReversed": false,

"customData": {

"trellis": false,

"connectNulls": "Leave gaps",

"stack": false,

"pointScale": 10,

"isPointColor": false,

"dataFields": [

"dataset",

"_raw",

"source",

"host",

"_time",

"mtr_TestId",

"mtr_Dst",

"mtr_DstPort",

"mtr_Protocol",

"mtr_PktCount",

"system.name",

"system.arch",

"system.os_version",

"system.os_version_id",

"system.platform",

"system.release",

"service.name",

"cribl_pipe",

"datatype",

"data_source"

],

"seriesCount": 4

},

"xAxis": {

"labelOrientation": 0,

"position": "Bottom",

"dataField": "_time"

},

"yAxis": {

"position": "Left",

"scale": "Linear",

"splitLine": true,

"dataField": "netsynth, 1.1.1.1"

},

"legend": {

"position": "Bottom",

"truncate": false

},

"timestats": false

},

"search": {

"type": "inline",

"earliest": "-30m",

"latest": "now",

"query": "mtrStats\n| extend \n source = tostring(host),\n destination = tostring(mtr_dst),\n port = toint(mtr_dstPort),\n protocol = tostring(mtr_protocol),\n jitterAvg_ms = todouble(jitterAvg_ms),\n rttAvg_ms = todouble(rttAvg_ms),\n rttWorst_ms = todouble(rttWorst_ms),\n dnsLatency_ms = todouble(dnsLatency_ms),\n timestamp = todatetime(_time)\n| where mtr_hop == mtr_hopsTotal - 1\n| project \n timestamp, \n source,\n destination, \n port,\n protocol,\n mtr_hopsTotal,\n dnsLatency_ms,\n rttAvg_ms, \n rttWorst_ms \n| order by timestamp desc\n| summarize \n dnsLatency = round(max(dnsLatency_ms),2),\n avgLatency = round(avg(rttAvg_ms),2), \n maxLatency = round(max(rttWorst_ms),2),\n avgHops = round(avg(mtr_hopsTotal),0),\n maxHops = max(mtr_hopsTotal)\n by source, destination, port, protocol\n| extend dnsLatency = iif(dnsLatency == 0, \"Not Tested\", tostring(dnsLatency))"

},

"id": "qma0u8g2y-copy",

"type": "list.table",

"layout": {

"x": 0,

"y": 0,

"w": 6,

"h": 3

},

"title": "Last Hop Latency & DNS Lookup Time (Last 30m)"

},

{

"config": {

"colorPalette": 0,

"colorPaletteReversed": false,

"customData": {

"trellis": false,

"connectNulls": "Leave gaps",

"stack": false,

"dataFields": [

"_time",

"netsynth, 1.1.1.1",

"netsynth, ntp.ubuntu.com",

"netsynth, opentelemetry.io",

"netsynth, www.cribl.io"

],

"seriesCount": 4

},

"xAxis": {

"labelOrientation": 0,

"position": "Bottom"

},

"yAxis": {

"position": "Left",

"scale": "Linear",

"splitLine": true

},

"legend": {

"position": "Bottom",

"truncate": false

},

"onClickAction": {

"type": "None"

},

"timestats": true,

"axis": {

"xAxis": "_time",

"yAxis": [

"netsynth, 1.1.1.1",

"netsynth, ntp.ubuntu.com",

"netsynth, opentelemetry.io",

"netsynth, www.cribl.io"

]

}

},

"search": {

"type": "inline",

"earliest": "-30m",

"latest": "now",

"query": "dataset=\"mtrStats\" | timestats span=1m round(sum(rttAvg_ms),2) by host, mtr_dst "

},

"id": "raikc2iu2",

"type": "chart.area",

"layout": {

"x": 6,

"y": 0,

"w": 6,

"h": 4

},

"title": "Avg rtt (ms) by host and destination (Last 30m)"

},

{

"config": {

"colorPalette": 0,

"colorPaletteReversed": false,

"customData": {

"trellis": false,

"connectNulls": "Leave gaps",

"stack": false,

"pointScale": 10,

"isPointColor": false,

"dataFields": [

"_time",

"netsynth, 1.1.1.1",

"netsynth, ntp.ubuntu.com",

"netsynth, opentelemetry.io",

"netsynth, www.cribl.io",

"netsynth, 192.168.64.1"

],

"seriesCount": 5

},

"xAxis": {

"labelOrientation": 0,

"position": "Bottom",

"dataField": "_time"

},

"yAxis": {

"position": "Left",

"scale": "Linear",

"splitLine": true,

"dataField": "netsynth, 1.1.1.1"

},

"legend": {

"position": "Bottom",

"truncate": false

},

"onClickAction": {

"type": "None"

},

"timestats": true,

"axis": {

"xAxis": "_time",

"yAxis": [

"netsynth, 1.1.1.1",

"netsynth, ntp.ubuntu.com",

"netsynth, opentelemetry.io",

"netsynth, www.cribl.io",

"netsynth, 192.168.64.1"

]

}

},

"search": {

"type": "inline",

"earliest": "-30m",

"latest": "now",

"query": "mtrStats\n| extend \n source = tostring(host),\n destination = tostring(mtr_dst),\n protocol = tostring(mtr_protocol),\n dnsLatency_ms = todouble(dnsLatency_ms),\n timestamp = todatetime(_time)\n| project \n timestamp, \n source,\n destination, \n protocol,\n dnsLatency_ms\n| timestats span=1m\n dnsLatency = round(max(dnsLatency_ms),2)\n by source, destination"

},

"id": "qma0u8g2y-copy-copy",

"type": "chart.area",

"layout": {

"x": 0,

"y": 3,

"w": 6,

"h": 6

},

"title": "DNS Lookup Latency (Last 30m)"

},

{

"config": {

"colorPalette": 0,

"colorPaletteReversed": false,

"customData": {

"trellis": false,

"connectNulls": "Leave gaps",

"stack": false,

"pointScale": 10,

"isPointColor": false,

"dataFields": [

"_time",

"netsynth, 1.1.1.1",

"netsynth, ntp.ubuntu.com",

"netsynth, opentelemetry.io",

"netsynth, www.cribl.io"

],

"seriesCount": 4

},

"xAxis": {

"labelOrientation": 0,

"position": "Bottom",

"dataField": "_time"

},

"yAxis": {

"position": "Left",

"scale": "Linear",

"splitLine": true,

"dataField": "netsynth, 1.1.1.1"

},

"legend": {

"position": "Bottom",

"truncate": false

},

"onClickAction": {

"type": "None"

},

"timestats": true,

"axis": {

"xAxis": "_time",

"yAxis": [

"netsynth, 1.1.1.1",

"netsynth, ntp.ubuntu.com",

"netsynth, opentelemetry.io",

"netsynth, www.cribl.io"

]

}

},

"search": {

"type": "inline",

"earliest": "-30m",

"latest": "now",

"query": "dataset=\"mtrStats\" | timestats avg(mtr_hopsTotal) by host, mtr_dst "

},

"id": "qma0u8g2y",

"type": "chart.area",

"layout": {

"x": 6,

"y": 4,

"w": 6,

"h": 5

},

"title": "Avg hop count by host & destination (Last 30m)"

}

]

}
Need a Cribl Account?
Cribl, the Data Engine for IT and Security, empowers organizations to transform their data strategy. Customers use Cribl’s suite of products to collect, process, route, and analyze all IT and security data, delivering the flexibility, choice, and control required to adapt to their ever-changing needs.
We offer free training, certifications, and a free tier across our products. Our community Slack features Cribl engineers, partners, and customers who can answer your questions as you get started and continue to build and evolve. We also offer a variety of hands-on Sandboxes for those interested in how companies globally leverage our products for their data challenges.