So, you finally have Cribl Edge collecting Logs, Metrics, and Events from your Kubernetes clusters and scraping your Prometheus endpoints. This post will guide you in enriching your events and metrics to help you identify and spot trends or anomalies in the performance of your containers.
Why Do We Need to Enrich Our Kubernetes Logs and Metrics Further?
For all the advancements we’ve gained from moving to cloud-native architectures, like increased scalability and more frequent deployments, we’ve also increased the complexity of our applications, making it harder to troubleshoot.
Today, more apps are spread across many interconnected services, containers, and cloud resources. Trying to pinpoint the source of an issue, especially when there are numerous moving parts, often increases our mean time to resolution. If you’ve built your application to be resilient in multiple regions, will your telemetry have enough context to help your teams know where to start their troubleshooting effort? Wouldn’t it be great to run a query in your observability tool and filter metrics by cloud region? Well, we’ve got you covered.
Cribl Edge to the Rescue!
Cribl Edge gathers metadata from your Kubernetes cluster when it receives an event, like a log or a metric. The information includes details about your cloud provider, containers, and other resources used in your cloud-native apps. Adding this contextual information to your metrics or logs is invaluable when investigating issues because it helps you understand which components are affected in the event of a problem.
By leveraging Cribl’s Pipeline, we’ll add relevant metadata each time we process an event (e.g., log, trace, or metric) to give your teams the context they’ll need. First, we’ll add details about the cloud resources and your pods running in Kubernetes.
Later, we’ll look at how you can leverage this additional data to help reduce your mean-time-to-resolution and improve your alerts.
Adding Cloud Provider Details to Your Events
Suppose you’ve deployed your services into multiple regions. In that case, it’s beneficial to review performance by region or narrow down your queries to the specific environment when troubleshooting an issue.
Thankfully, OpenTelemetry defines some semantic conventions for workloads running in the cloud. Using those conventions, we can add details like the region and availability zone to help understand where your Kubernetes log, event, or metrics came from.
Cribl Edge automatically collects and adds AWS instance metadata to your Events, which is added to an internal field named __metadata.aws. You can see all this data by enabling the ‘Show Internal Fields’ option when looking at events in the Live Data tab for a source.
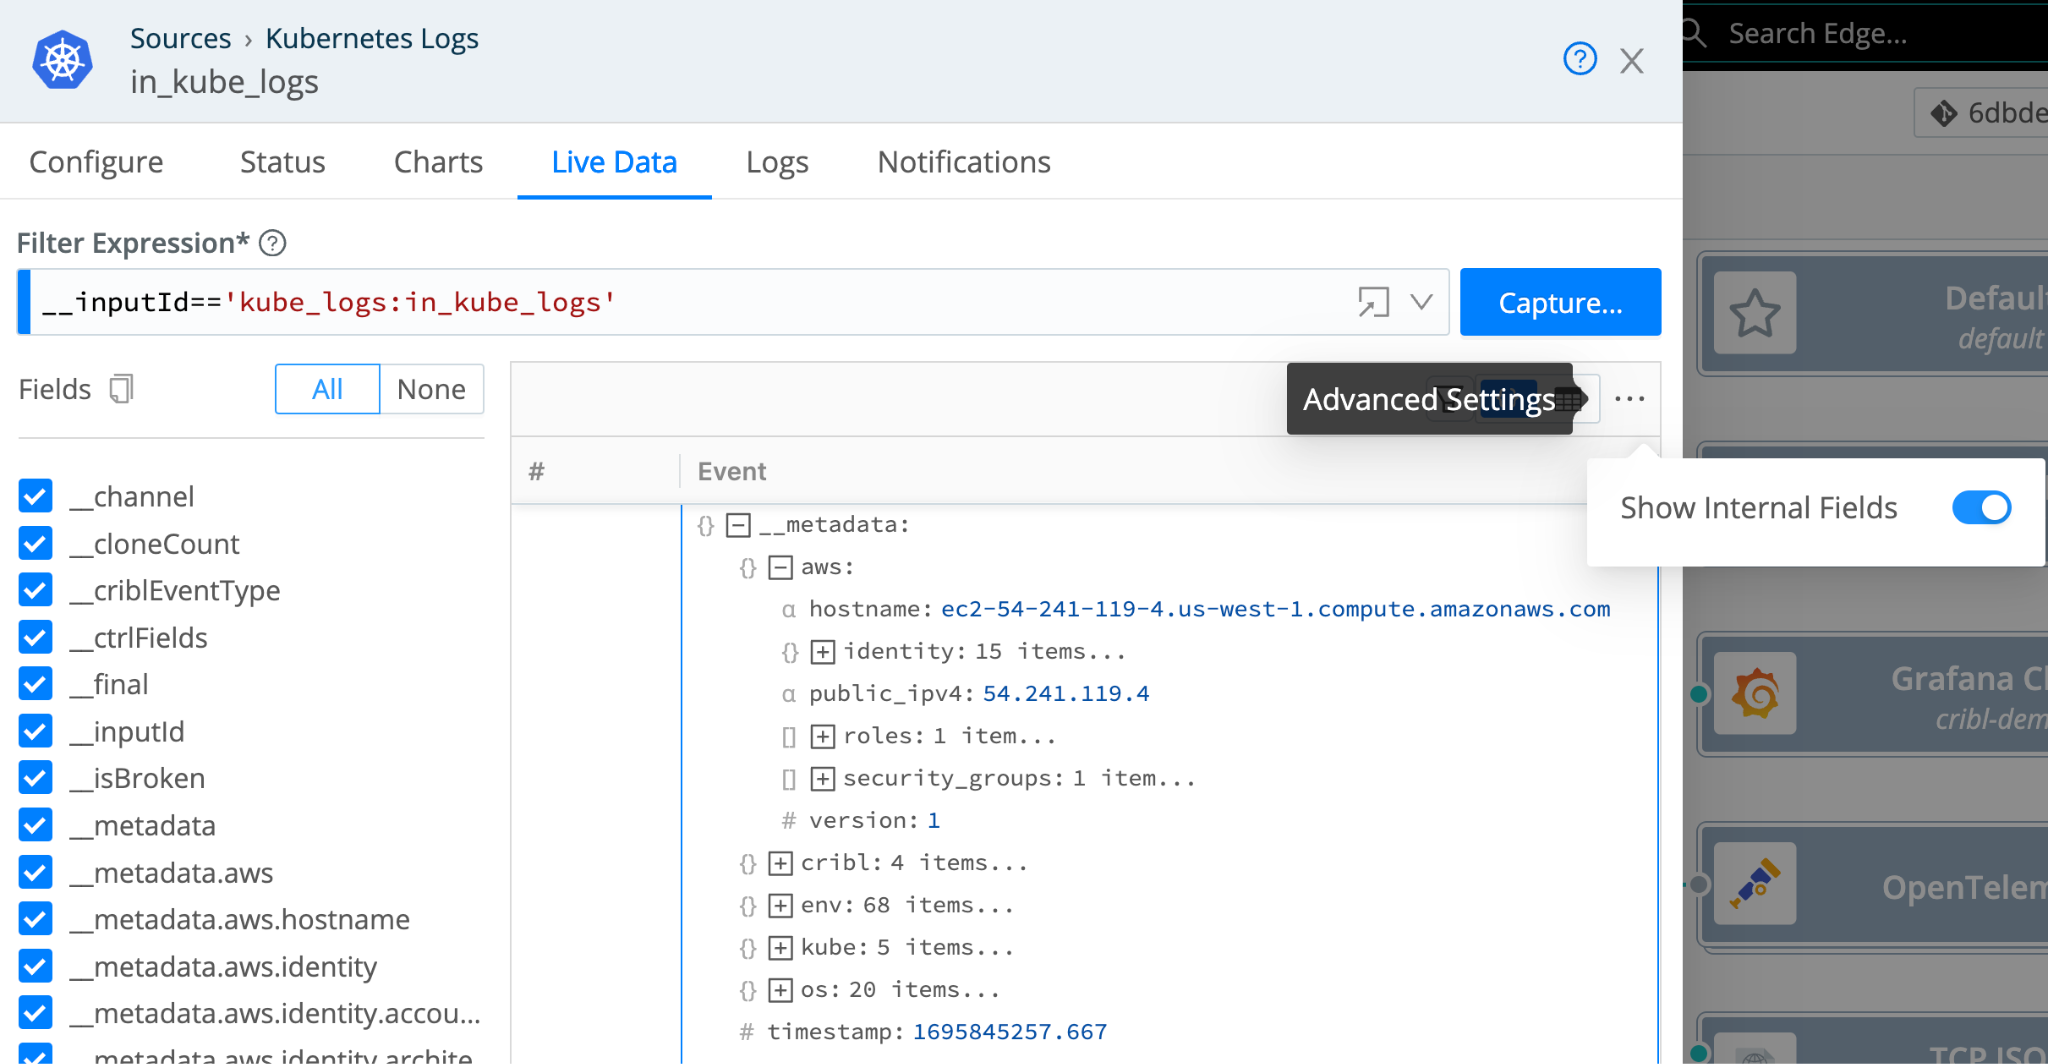
As you can see, within the __metadata.aws field, valuable detail can be included in your metrics when you send them to your downstream observability tools.
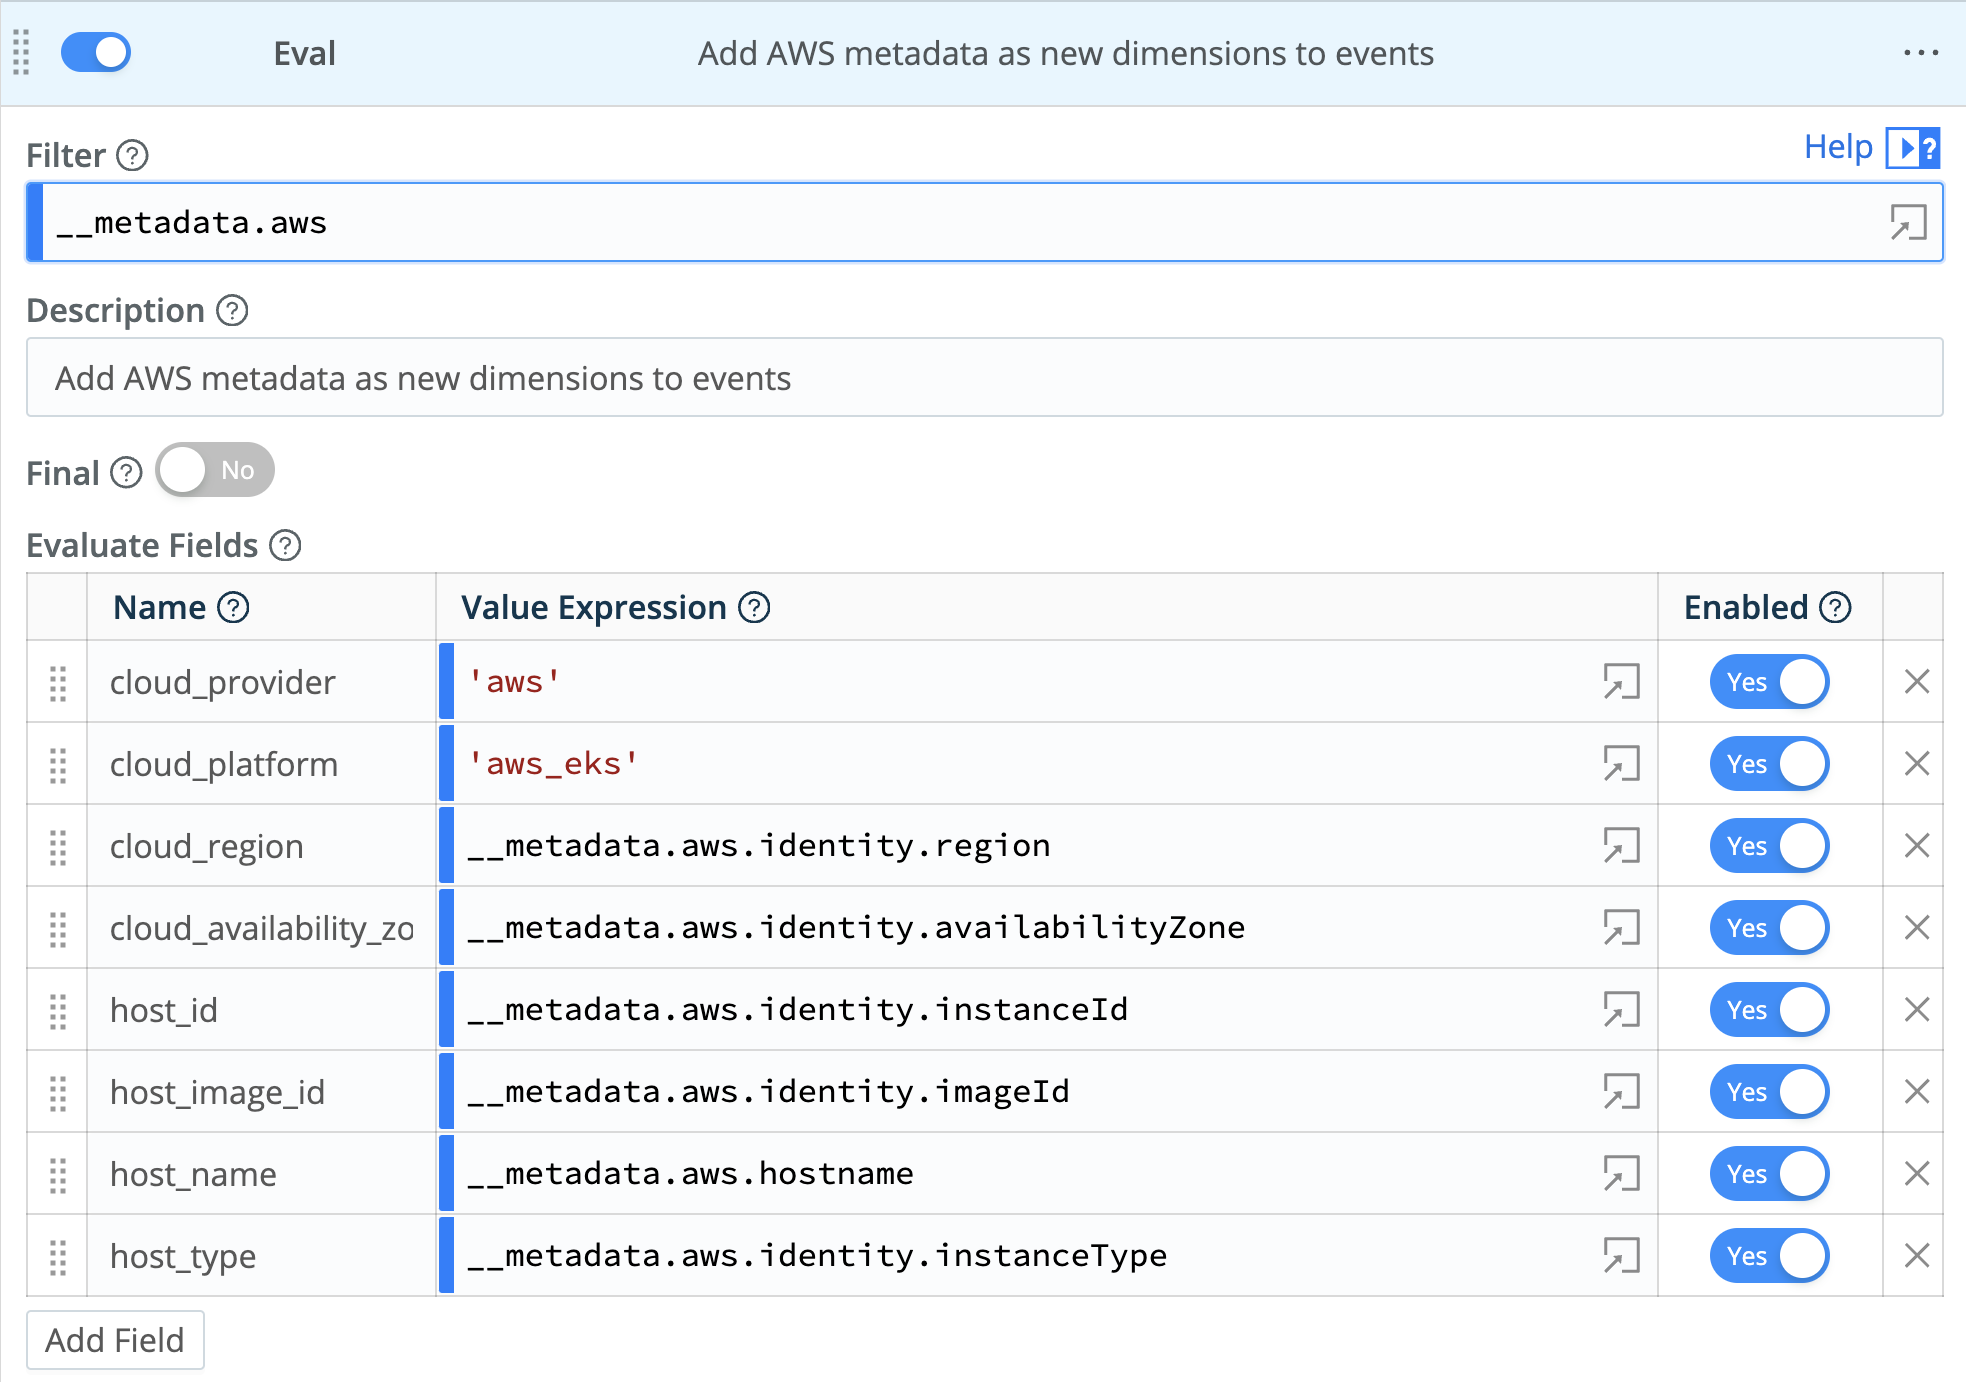
To add this to your Kubernetes Logs, Events, and Metrics, we’ll add an Eval function to a Pipeline, then filter on the following:
__metadata.aws
This ensures that we only add AWS metadata when the field exists within an Event or Metric in our pipeline. Don’t worry; we are also adding support for your workloads running in Azure and Google Cloud!
Use the Evaluate Fields table to add key-value pairs to our events within the Eval function. In addition to the dimensions under the cloud namespace defined by the OTEL conventions, we’ll add some details about the AWS host, the instance type, and image ID, which can be helpful if you’re trying to spot issues with Node Group instance types in your AWS Elastic Kubernetes Service clusters.
You can use the Enabled toggle for each field to not include the information if you don’t find it helpful.
Here’s our complete Eval function:
And here is what an enriched metric looks like. All the dimensions that our pipeline added are colored green in the following image:
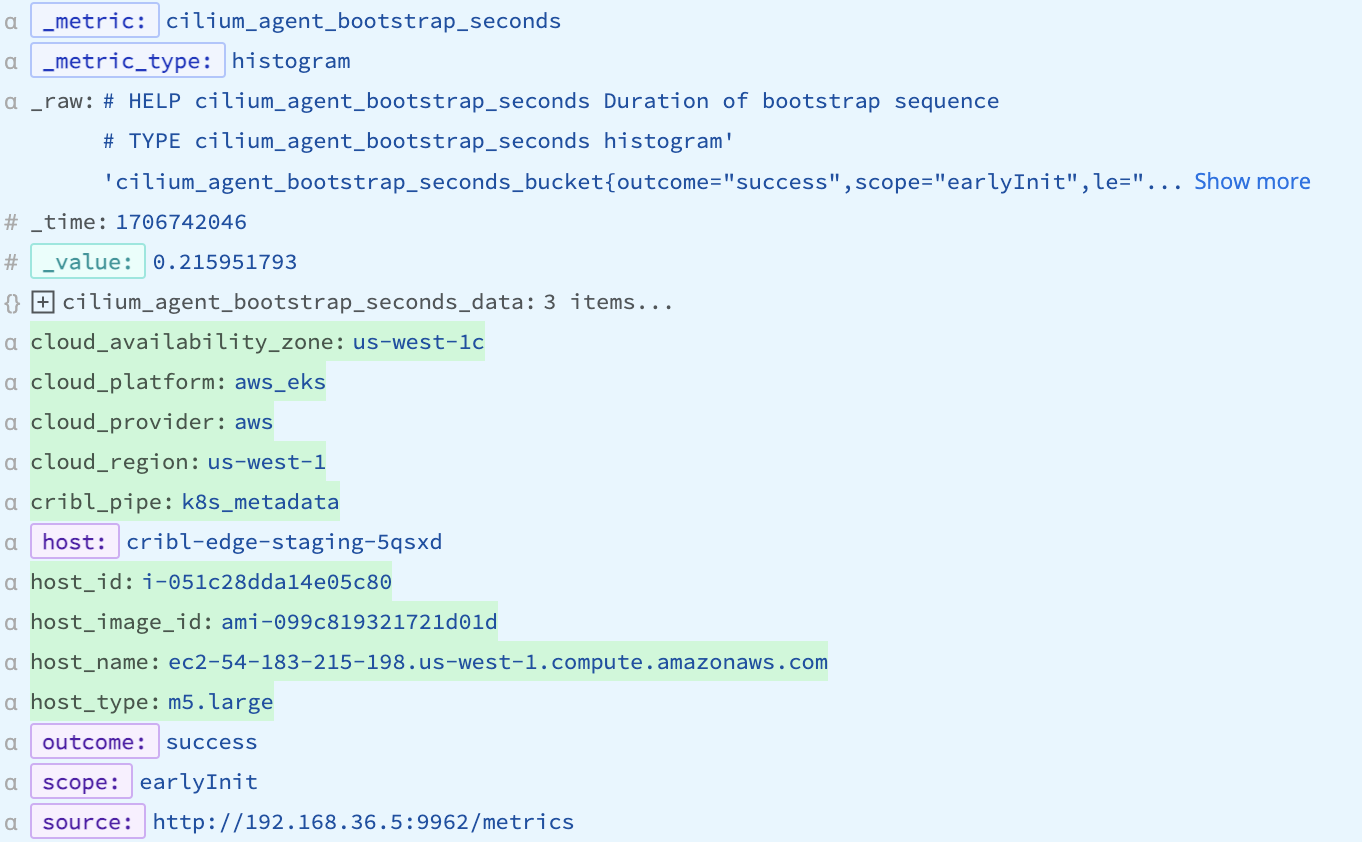
In your time-series database, you can use any of these dimensions for your dashboard queries or alerts to provide additional context to your teams on their deployed services, as we’ll see later.
Adding Kubernetes Resource Attributes
Now that you’ve enriched your events with your cloud provider details, the next step is to add some relevant Kubernetes info to your spans, metrics, and logs. Cribl Edge uses the Kubernetes API to discover information about the pods running within your cluster and makes namespace, node, and pod metadata available within different __kube_* fields.
If you’ve deployed multiple replicas for one of your Kubernetes Deployments, you know how frustrating it is to receive an alert when a Pod hits some request limits, but you don’t know which one. We will add more detail next to help your teams quickly pinpoint the problematic Pod, making it easier to investigate logs, events, and other data specific to that Pod.
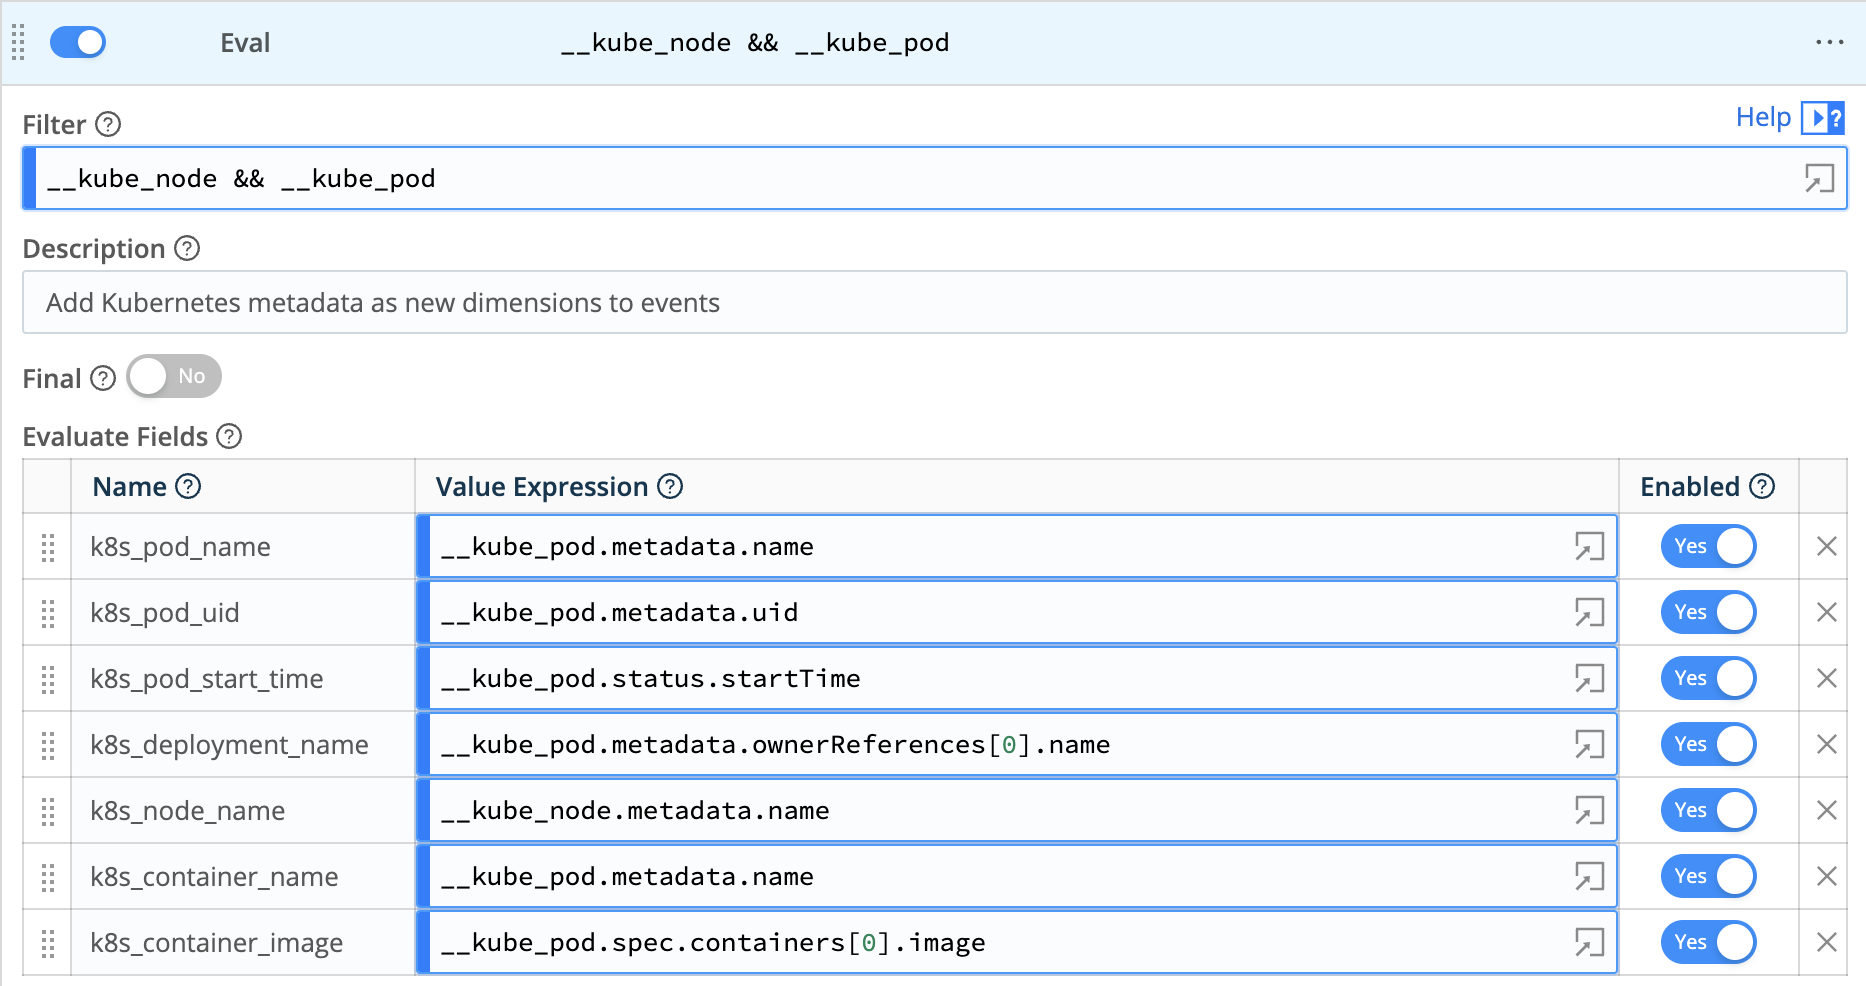
Again, we’ll use OpenTelemetry Semantic conventions for Kubernetes to add a clear and useful set of attributes to your events. In our pipeline, we’ll add another Eval function to add the following dimensions:
- k8s_namespace_name
- k8s_pod_name
- k8s_pod_uid
- k8s_deployment_name
- k8s_node_name
To add this to Kubernetes Logs, Events, and Metrics, add an Eval function to a Pipeline, then filter on the following:
__kube_node && __kube_pod
This ensures we only add the Kubernetes metadata when the internal __kube_* fields exist within an Event or Metric in our pipeline. You may need to adjust the above filter to drop the last half of the expression if you’ve set up a Prometheus Edge Scaper using Kubernetes Node for its Discovery Type.
Again, we will use the Evaluate Fields option to add key-value pairs to our events. Here is the complete Eval function we’ve added to our pipeline.
I’m Enriched! Now What?
Now that you’ve enriched your metrics, how should you use them? Let’s say an application team is tracking the request rate for a workload using a metric named http_req_total. You can view those metrics broken down by region by adding the cloud_region to your PromQL queries :
sum(irate(http_req_total{service="$service",http_status_code!~"5.*"}[5m])) by (service, cloud_region) /
sum(irate(http_req_total{service="$service"}[5m])) by (service, cloud_region)
You can also enrich your AlertManager alerts when your latency goes above a pre-defined threshold and know which region is being impacted:
# Alert for any instance that has a median request latency >1s.
  - alert: APIHighRequestLatency
    expr: sum by (cloud_region) api_http_request_latencies_second{quantile="0.5"} > 1
    for: 10m
    annotations:
      summary: "High request latency on {{ $labels.instance }} in {{ $labels.cloud_region }} region"
      description: "{{ $labels.instance }} has a median request latency above 1s (current value: {{ $value }}s) in {{ $labels.cloud_provider }} - {{ $labels.cloud_region }}"
Try Out Enriching Your Metrics With Edge and Cribl Cloud Today
If you’re interested in Cribl Edge for Kubernetes observability, it’s time to try it out for yourself. We offer a Kubernetes Observability with Cribl Edge Sandbox, which guides you through installing Cribl Edge on a Kubernetes cluster using our Helm Charts.
Cribl.Cloud is the easiest way to start with metrics, logs, and traces. Our generous free tier includes up to 1 TB/day to test our Cribl Edge with your Kubernetes clusters. Sign up for free now!
Cribl, the Data Engine for IT and Security, empowers organizations to transform their data strategy. Customers use Cribl’s suite of products to collect, process, route, and analyze all IT and security data, delivering the flexibility, choice, and control required to adapt to their ever-changing needs.
We offer free training, certifications, and a free tier across our products. Our community Slack features Cribl engineers, partners, and customers who can answer your questions as you get started and continue to build and evolve. We also offer a variety of hands-on Sandboxes for those interested in how companies globally leverage our products for their data challenges.