Cribl puts your IT and Security data at the center of your data management strategy and provides a one-stop shop for analyzing, collecting, processing, and routing it all at any scale. Try the Cribl suite of products and start building your data engine today!
Learn more ›
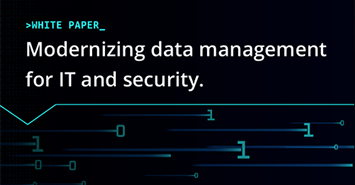
Evolving demands placed on IT and Security teams are driving a new architecture for how observability data is captured, curated, and queried. This new architecture provides flexibility and control while managing the costs of increasing data volumes.
Read white paper ›Cribl Stream is a vendor-agnostic observability pipeline that gives you the flexibility to collect, reduce, enrich, normalize, and route data from any source to any destination within your existing data infrastructure.
Learn more ›Cribl Edge provides an intelligent, highly scalable edge-based data collection system for logs, metrics, and application data.
Learn more ›Cribl Search turns the traditional search process on its head, allowing users to search data in place without having to collect/store first.
Learn more ›Cribl Lake is a turnkey data lake solution that takes just minutes to get up and running — no data expertise needed. Leverage open formats, unified security with rich access controls, and central access to all IT and security data.
Learn more ›The Cribl.Cloud platform gets you up and running fast without the hassle of running infrastructure.
Learn more ›Cribl.Cloud Solution Brief
The fastest and easiest way to realize the value of an observability ecosystem.
Read Solution Brief ›Cribl Copilot gets your deployments up and running in minutes, not weeks or months.
Learn more ›AppScope gives operators the visibility they need into application behavior, metrics and events with no configuration and no agent required.
Learn more ›Explore Cribl’s Solutions by Use Cases:
Explore Cribl’s Solutions by Integrations:
Explore Cribl’s Solutions by Industry:
September 25 | 10am PT / 1pm ET
Hold my beer: lessons from one team’s data pipeline journey
Register ›Try Your Own Cribl Sandbox
Experience a full version of Cribl Stream and Cribl Edge in the cloud.
Launch Now ›Get inspired by how our customers are innovating IT, security and observability. They inspire us daily!
Read Customer Stories ›Sally Beauty Holdings
Sally Beauty Swaps LogStash and Syslog-ng with Cribl.Cloud for a Resilient Security and Observability Pipeline
Read Case Study ›Experience a full version of Cribl Stream and Cribl Edge in the cloud.
Launch Now ›Transform data management with Cribl, the Data Engine for IT and Security
Learn More ›
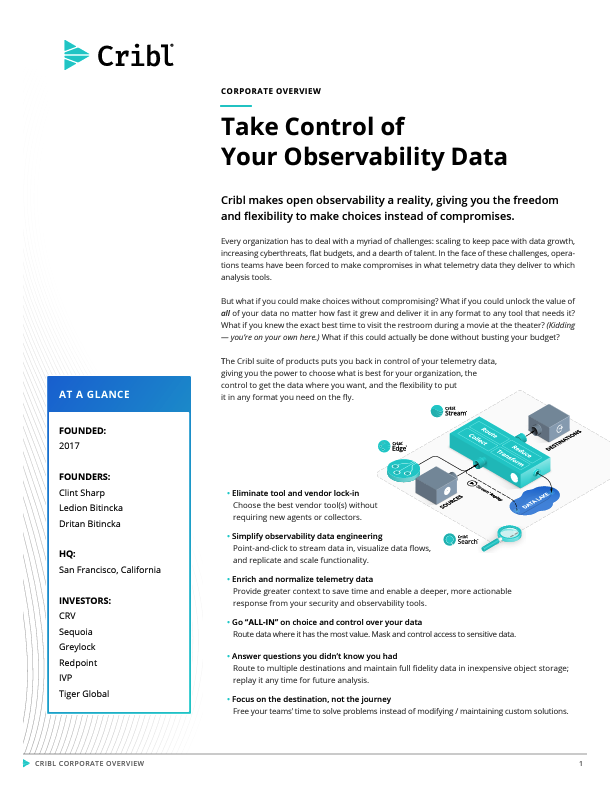
Cribl Corporate Overview
Cribl makes open observability a reality, giving you the freedom and flexibility to make choices instead of compromises.
Get the Guide ›Stay up to date on all things Cribl and observability.
Visit the Newsroom ›Cribl’s leadership team has built and launched category-defining products for some of the most innovative companies in the technology sector, and is supported by the world’s most elite investors.
Meet our Leaders ›Join the Cribl herd! The smartest, funniest, most passionate goats you’ll ever meet.
Learn More ›Whether you’re just getting started or scaling up, the Cribl for Startups program gives you the tools and resources your company needs to be successful at every stage.
Learn More ›Want to learn more about Cribl from our sales experts? Send us your contact information and we’ll be in touch.
Talk to an Expert ›Coming from an IT Operations background, I relied heavily on logs and metrics generated by the various platforms I supported to gain insights into the global deployments. The data points were often transformed into dashboards and alerts, allowing the team to monitor the environments effectively and remediate any issues that occurred in a timely manner.
Cribl Stream’s integration with New Relic One facilitates this solution. By sending Cribl Stream Metrics and Worker Node Logs through the platform and having them land in New Relic One, an Organization’s Operations team can monitor the Cribl Stream environment outside the direct infrastructure. In addition, the partnership between Cribl and New Relic has led to the development of an Instant Observability Stream Metrics dashboard that can be installed in an existing New Relic One environment via a Quickstart link. This dashboard extends the capabilities of the Monitoring console available in Cribl Stream today.
In this blog, we’ll not only configure Cribl Stream to send metrics to New Relic, but also launch the Quickstart dashboard and review the available metrics within the New Relic One platform.
To begin generating the Cribl Stream Metrics, navigate to Sources → Cribl Internal and toggle the Enabled switch to On for the CriblMetrics input.
Next, we’ll configure the New Relic One Destination by navigating to Destinations → New Relic Ingest: Logs & Metrics. Select + Add New and configure the inputs specific to your New Relic One environment.
You must use an INGEST API Key from New Relic and can either copy an existing or generate a new key within the New Relic interface by navigating to Settings → API Keys → Create a Key
After both the source and destination are defined, create the Route to send the Cribl Stream Metrics to the New Relic One environment and Commit & Deploy the configurations.
Once you’ve confirmed that data is flowing through your Cribl Stream environment and into New Relic One, you can explore the metrics within the system.
On the New Relic landing page, select Browse Data → Metrics from the horizontal navigation bar. This will generate a page that looks similar to the screenshot below. This view gives end-users the ability to search the various Cribl Stream metrics and review the dimensions the data can be filtered and split by.
By installing the Cribl Stream quickstart dashboard available in New Relic’s Instant Observability marketplace, teams can quickly begin monitoring their Cribl Stream deployment and create alerts specific to their environment.
Navigate to the Cribl Stream Instant Observability (I/O) landing page and log in. Clicking the green +Install Quickstart button will redirect you to a page within your New Relic One instance to confirm and begin your quickstart installation.
Once installed, you’ll see the LogStream Metrics dashboard available in your list of configured dashboards.
Drilling into the dashboard, you can view graphics and summary metrics similar to what exists on the Monitoring tab in Cribl Stream. In addition to the total Events and Bytes In/Out on the landing page, there are additional tabs outlining the volume of data being sent from the Sources to the Destinations and streaming through the various Routes and Pipelines. End-Users can also review reduction metrics associated with the Pipelines configured in their environment or use the filter feature for troubleshooting, by narrowing the scope (individual worker process, etc) of the presented data.
To enhance monitoring capabilities further, end users can configure custom alert conditions within New Relic One to trigger notification channels such as email, PagerDuty, Slack, and VictorOps. These alerts can be created in the Policies section of the Alerts & AI page and may include thresholds for specific Sources and Destinations or throughput restrictions for individual Worker Processes.
Cribl Stream gives you the freedom to choose your platform monitoring solution. And the initial setup is as easy as enabling the default metrics and sending them to your existing system of analysis. Feel free to explore the metrics dashboard we’ve configured for New Relic as inspiration, and know we’re always available to help on our Community Slack!
Experience a full version of Cribl Stream and Cribl Edge in the cloud with pre-made sources and destinations.
Classic choice. Sadly, our website is designed for all modern supported browsers like Edge, Chrome, Firefox, and Safari
Got one of those handy?