The Cribl Syslog source is our most commonly used input type. Cribl Stream can act as your edge and/or central syslog server, giving you more capability while easing management tasks. In this blog post we’ll go over a brief history of syslog. Then we’ll dive into best practices for standing up Cribl Stream as a syslog server, tuning the server, and other tips for running a high performance syslog platform.
Table of Contents:
What is syslog?
Open source and UNIX godfather Eric Allman created the first syslog server as part of the sendmail project. For many years syslog existed without any hard standards or protocol definition. In the early 2000s RFC 3164 was published, documenting what was most commonly used as “syslog” in the wild. RFC 5424 standardized it more formally in 2009.
Fun fact: Several Cribl Goats worked with Mr Allman at Sendmail!
TL;DR version: A syslog event is normally a single line, starting with facility and priority, followed by the message. The message also has a few expected tags, like app name and often a log level. The syslog payload should use UTF-8 encoding.
Syslog has remained the de facto standard way to deliver log events. Many apps and systems offer syslog as a delivery option, and nearly every SIEM and search tool accepts syslog as an input. It’s the lowest common denominator for moving events around.
Setting Up Cribl Stream as a Syslog Server
Cribl makes it easy to stand up a Cribl Stream syslog source. There is one set of configs to get the port listening: Give it a name; a port to listen on; and whether you need TCP, UDP or both. By default Cribl will handle parsing the basic syslog structure. You are then able to use Cribl’s features to route, transform, filter, reshape, aggregate, and re-deliver the data any way you please.
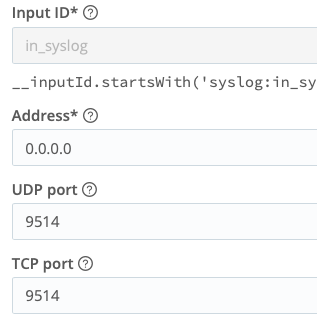
TIP: Don’t change the 0.0.0.0 entry unless you know precisely what you’re doing. There are very few use cases where it makes sense to. All your Worker Nodes in the group receive this config. No two Nodes should have the same IPs outside of 0.0.0.0 and 127.0.0.1. The 0.0.0.0 tells the system to listen to all interfaces and addresses. A 127.0.0.1 entry would mean only listen on localhost.
TIP: Some sources send using RFC-6587, which defines the length of the syslog message at the front of the payload. This feature allows for absolute accuracy in event breaking. If your syslog sender supports it, we recommend enabling it. Cribl’s syslog source supports RFC-6587 on its Advanced Settings tab, with a toggle labeled “Octet count framing”:
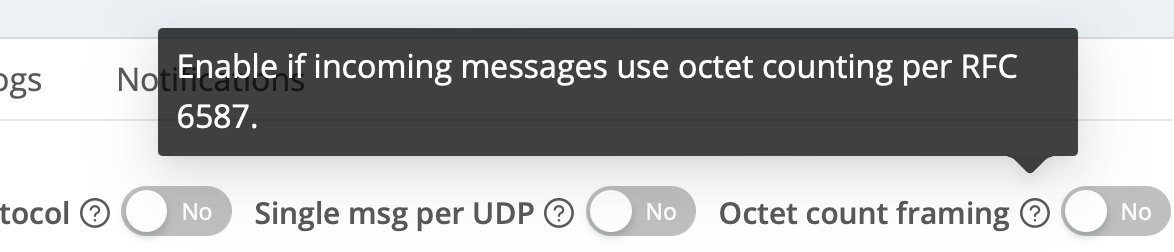
⚠️Update! Since this blog was published, Cribl version 4.7.0 now auto-recognizes RFC 6587 messages. The option to set it manually is no longer available. Like magic!
TIP: We always recommend establishing Cribl Stream instances as close as possible to your syslog producers. Especially with UDP, this is vital since there is no guarantee of delivery. But even with TCP, with relatively long communication channels and more places to bottleneck, it’s best to get the logs into Stream ASAP, where they are safe and sound. Finally, most syslog senders do not have queuing capabilities. If the destination doesn’t respond quickly enough, events could be lost. (See persistent queuing, later in this post, to remedy this.)
TIP: There are intentionally no Event Breaker configs in Cribl syslog sources. The protocol defines what an event is. If you have a “syslog” source that causes events to be broken improperly, you should consider using a Raw TCP or Raw UDP source and a custom event breaker of your own making. I posted a video about this very topic not too long ago.
TLS
We aim to support Transport Layer Security (TLS) everywhere, and always recommend enabling TLS when possible. Setup is pretty straightforward in Cribl: Upload your certs into a Certificates config object: Group Settings -> Security -> Certificates. Then, in your TCP enabled syslog source, go to TLS, flip the enable switch, and select your uploaded cert in the drop down. Save, commit, and deploy. You’re done. (Bonus pro-tip: Set a reminder to renew the certificates!)
TIP: (anti-tip?) While Cloud Worker Nodes come out of the box with TLS ready to roll, we don’t normally recommend delivering syslog data over the Internet. Still, it’s available if absolutely needed. See your Data Sources page on the Cloud landing portal.
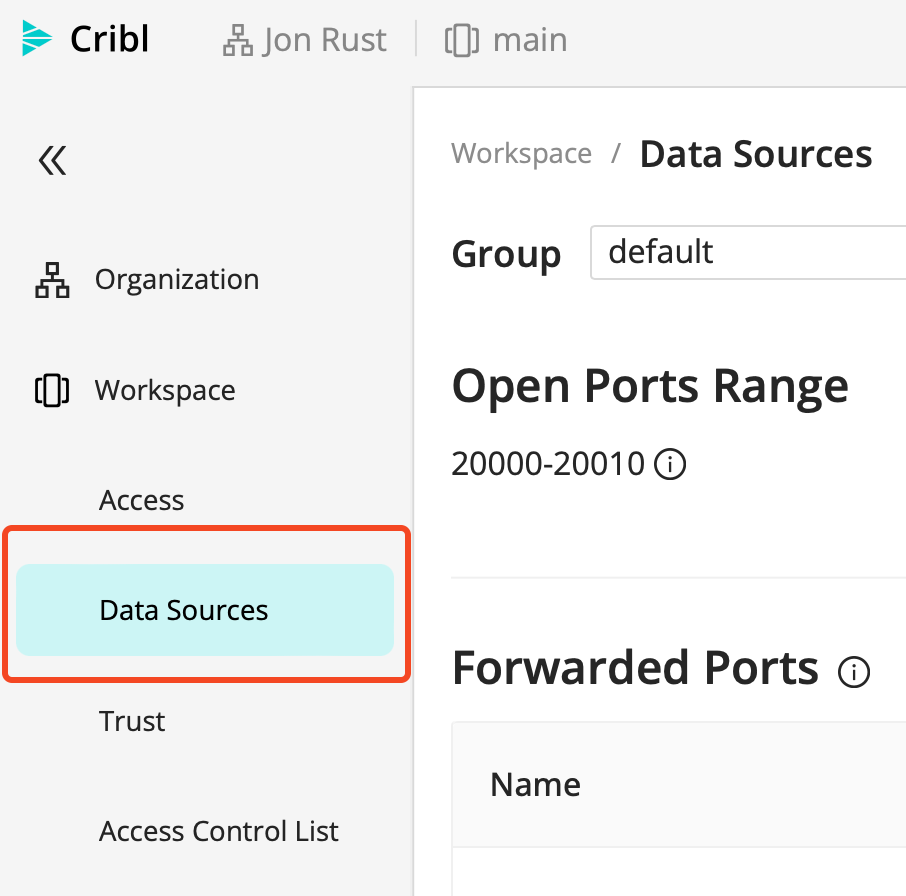
TIP: By default, Cloud Worker Groups have TLS syslog on port 6514. You’ll notice there are many TLS sources active in Cribl Cloud. Any of them can be disabled in Cribl Stream, and then repurposed on a different source. You also have 11 open, unused ports, 20000-20010.
For self-hosted or hybrid Cribl Workers, you can use any open port you want. Although ports under 1024 will need special permissions.
TIP: Palo Alto’s Panorama service requires TLS to be active on the receiving end, and not in a standard manner. We cover the details in our docs.
Load Balancing and Scaling
Most syslog-producing apps and appliances don’t have any concept of load balancing. You give them a hostname or IP, and a port, and they blast data at it. So the job of spreading those events over multiple hosts will be up to you. You’ll need a load balancing service or appliance in front of your Cribl Worker Nodes, like HAProxy, nginx, F5, Cisco, AWS ELB, or plenty of others.
One problem with TCP load balancing involves “sticking” or “pinning” to a connection. This happens because most load balancers are not syslog aware: They don’t know where one event ends and another begins. Once they have a connection, they hold onto it and just keep chucking data into it. That means you’re not effectively distributing your data across your resources.
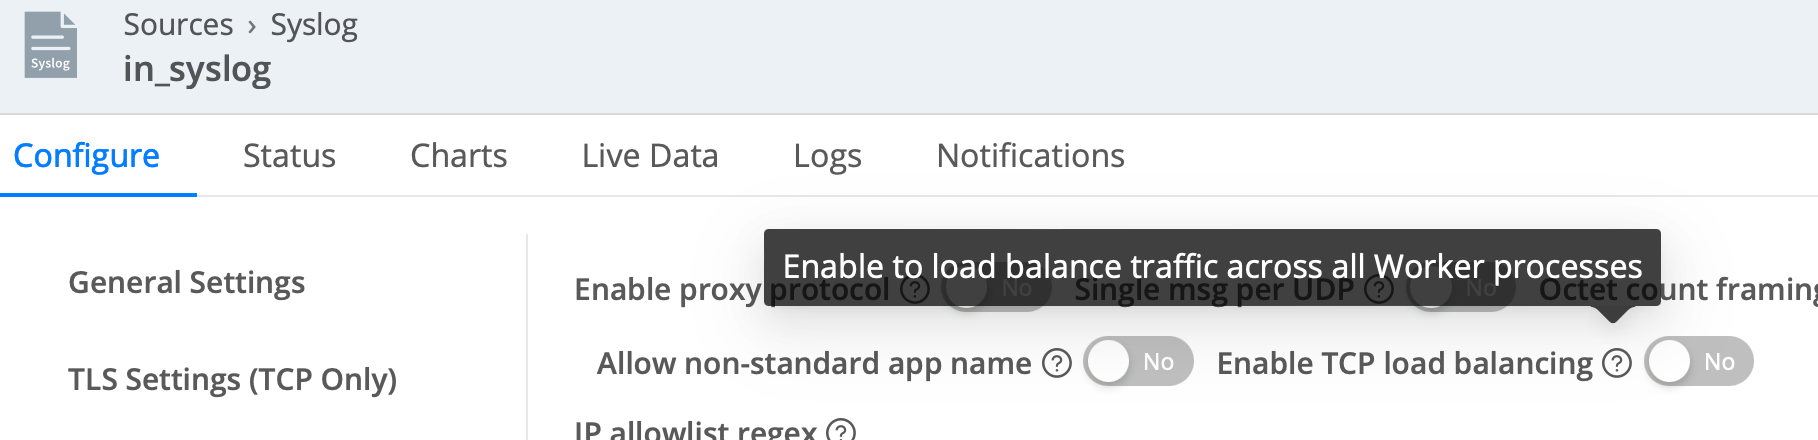
TIP: As of Cribl Stream 4.6.0, released in April 2024, you can enable a native syslog load balancing feature. This dedicates one process on each Worker Node to receive TCP syslog data, and fans out the resulting events across all Worker Processes on the Node. With a big enough instance, this solution will scale to ~100 MB/s of ingested syslog data per Node. (Equivalent to ~8.6 TB/day.)
TIP: If you enable this feature, be sure to account for the LB process!
Example: You have a 16-core system running with the default -2 setting. That means you have 14 processes that could handle processing, and 2 reserved for system overhead.
- Without the internal load balancer active, you risk the external load balancer “pinning” to a single process, so you’re not balanced across them all. This will limit your throughput to that of a single thread. Let’s fix it…
- With the internal load balancer active, an extra process is fired up, dedicated to receiving the syslog traffic. This process does one thing: Spray events evenly across all the available Worker Processes on the Node.
- Now, your throughput limit is equivalent to 14 cores. Win! But we’ve taken one of those 2 reserved cores (-2). Doh! Change the reserve to -3 and possibly add more cores to compensate if 13 processing cores aren’t enough.
TIP: Scaling recommendations:
- For HA reasons, don’t drop below 2 or preferably 3 Nodes in a Group, and size them so they can handle running 1 instance short (at least).
- If you’re at or below 8 cores per instance, scale up (adding cores) before scaling out (adding instances)
- If syslog is the primary source of volume in the Worker Group, consider dedicating a Worker Group just for syslog, and scale appropriately.
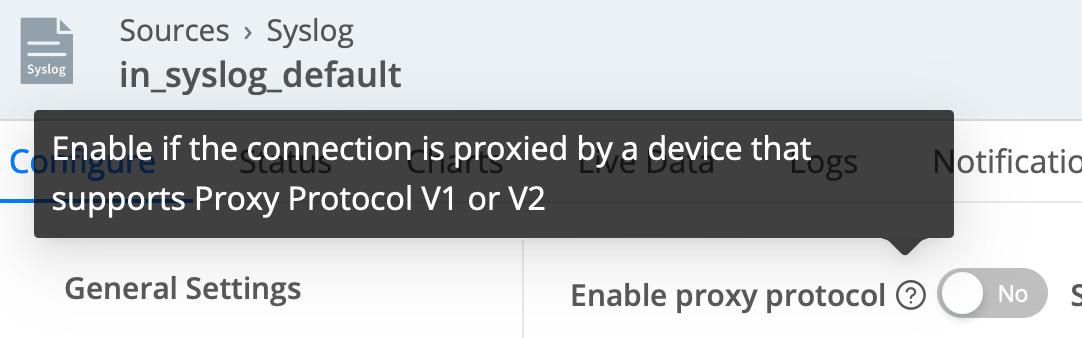
TIP: A side effect introduced by load balancers is the connection IP address. All connections will appear to come from this address instead of from the original log sender. Depending on your load balancer type, you may work around it by enabling proxy protocol support (as shown below), which will provide the original IP to Cribl Stream.
System Tuning for UDP Syslog
This section only applies to UDP-based syslog, not TCP, and is summarized from our excellent docs. It also does not apply to Cribl-managed Cloud Workers, where Cribl’s team of engineers will manage such things for you.
Incoming UDP traffic is put into a buffer by the Linux kernel. Cribl will drain from that buffer as resources are available. At lower throughput levels, and with plenty of available processes, this isn’t an issue. However, as you scale up, the default size of that buffer is almost always too small.
TIP: You can check the current buffer size with the following command. By default, this is usually too small for even moderately busy syslog. In the run below, it is a little over 200 KB, an amount easily overwhelmed by even a moderately busy syslog source.
$ sysctl net.core.rmem_max

net.core.rmem_max = 212992
TIP: And you should check (and monitor) the packet receive errors line:
$ netstat -su | grep 'receive errors'

0 packet receive errors
If packet receive errors are more than zero, you have almost certainly lost events, which is a particularly serious problem if the number of errors is increasing rapidly.
TIP: You can change the key settings on a live system to, for example, 25 MB:
$ sysctl -w net.core.rmem_max=26214400

net.core.rmem_max = 26214400

$ sysctl -w net.core.rmem_default=26214400

net.core.rmem_default = 26214400

To make the settings permanent change, add the following to /etc/sysctl.conf:

net.core.rmem_max=26214400

net.core.rmem_default=26214400
Different Ports, Dynamic Labels, Dedicated Worker Groups
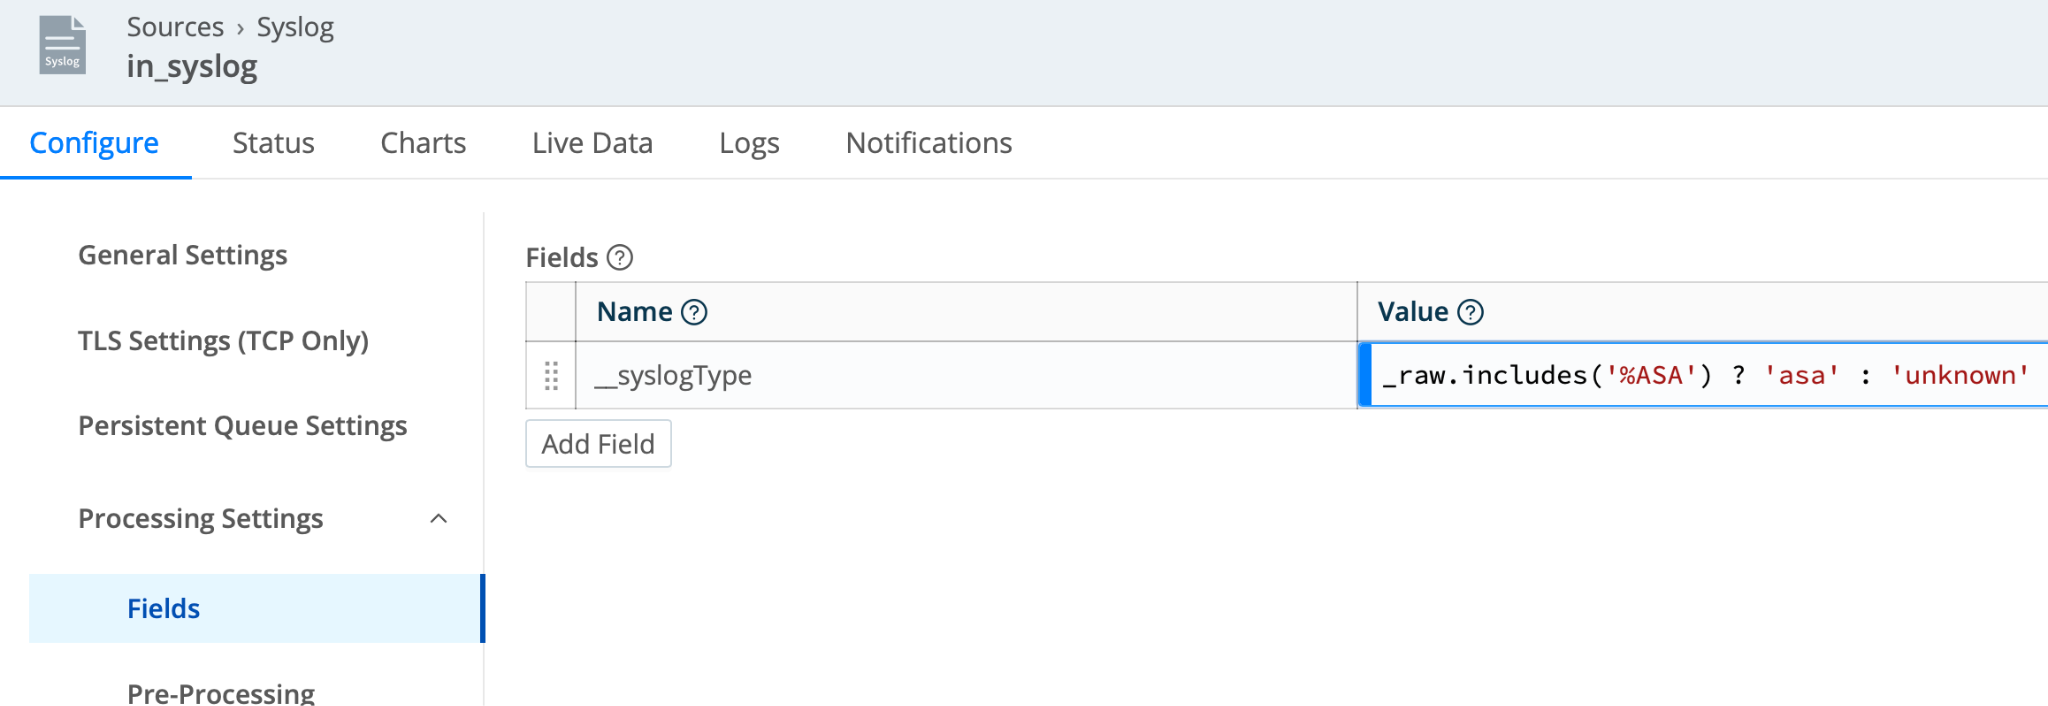
Syslog events are painfully simple. The message doesn’t always give obvious identifiers as to what kind of data you have. However, usually you can set up some pattern- or host-matching to id, and route which events are which types. You could do this in the Fields config area of the source, or in a pre-processing Pipeline. (See below for an example.)
Alternatively, use different ports for each type of data. For example, set Cisco ASA to use port 9514, while NX Log sends to 9515. Even in this case, I’d still lean toward using the Fields config to label the syslog data type accordingly.
TIP: For lighter loads (think < ~ 200 GB/day), our preference is to use a single port for all types. Then you can use the Fields config, or a pre-processing pipeline, to qualify the data types and label them appropriately. Qualification could be done via host lookups, patterns, etc.
For heavier loads or special cases that require a dedicated port, set-up their own port, and still use the Fields config to set the same label. This helps to keep your routing table sane. (See screencaps below.)
TIP: And finally, for extra large sources, you may want to consider an entirely isolated Worker Group. If, for example, 90% of your traffic is syslog, or a particular syslog source, throw that into its own Worker Group dedicated to optimizing syslog delivery.
Dead Letter Unwanted Data
TIP: Syslog can be prone to receiving unwanted logs. We recommend validating the host sending the logs, or possibly even the content. If the validation fails, dump the data to object store for (short!) retention only. Periodically check your dead letter dataset for valuable logs that have fallen through unintentionally.
Building on the previous tip, in this case I’m expecting only ASA data on this syslog source. If %ASA is in the log, i’m going to label it ‘asa’:
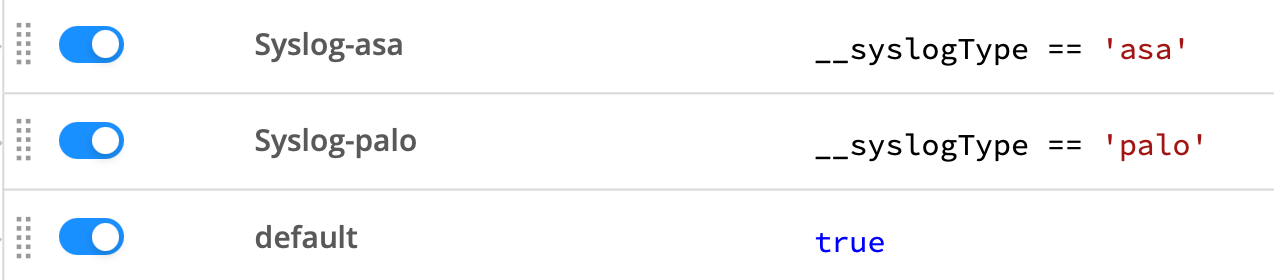
Now I can use __syslogType in my routing rules, presenting a uniform set of rules:
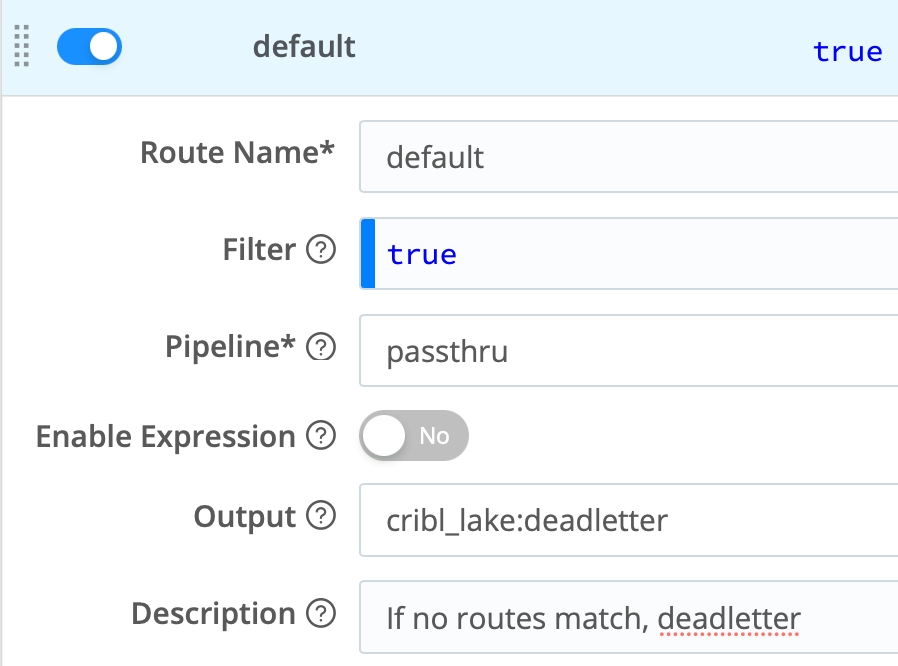
Finally, data that does not match would fall to the default rule at the bottom, either dropping the data or sending it to a “dead letter” storage pool in your long-term retention (object store, data lake, etc):
NOTE: This validation tip extends beyond syslog. We always encourage actively validating which logs end up in your analysis tier.
You can also use Cribl’s Schema Validation functionality.
Timestamps and ‘Zones: UTC to Rule them All
Many syslog senders still, in the year 2024, do not include a timezone in their timestamps. RFC-5424 requires TZ identification in the string, but earlier syslog specs did not. A timestamp without an explicit offset risks being misinterpreted, resulting in events in the future or the past. Fortunately, Cribl gives you the tools to fix this in most cases easily.

1.21 jiggawatts can’t help your future-stamped events, but Cribl can!
TIP: Normalize your time now now, not then now.
Option A: Use the Cribl Syslog Preprocessor Pack, or steal the idea from it: Lookup files to align particular hosts to the correct timezone, and Cribl’s Pipeline Functions to adjust event time accordingly.
Option B: Do future you a huge favor and proselytize UTC for all servers and appliances. Even if you choose Option A above, pursue this option long-term. UTC is the One True Way to log event time. Let the analysis and reporting tiers convert from UTC to local zones when, and if, they need to.
Persistent Queues
Being ready for unexpected downtime is crucial, especially when it comes to syslog. Most syslog senders, and all UDP syslog senders, do not buffer data if the receiving side is down or blocking. There are a few scenarios where Cribl’s syslog input is at risk of losing events:
- The destination on the other side of Cribl is down or rejecting data
- The destination on the other side of Cribl is so slow that Cribl can’t move events to it fast enough
- Cribl itself is overwhelmed processing events and not able to receive new data
TIP: To handle these situations Cribl Stream offers persistent queuing (PQ). Our recommendation is for always-on source-side PQ for most situations. See the docs for more info.
For Cloud-based Workers, it’s a simple enable flag for either type. For hybrid and on-prem Workers’ configs and sizing considerations, see our PQ planning guide.
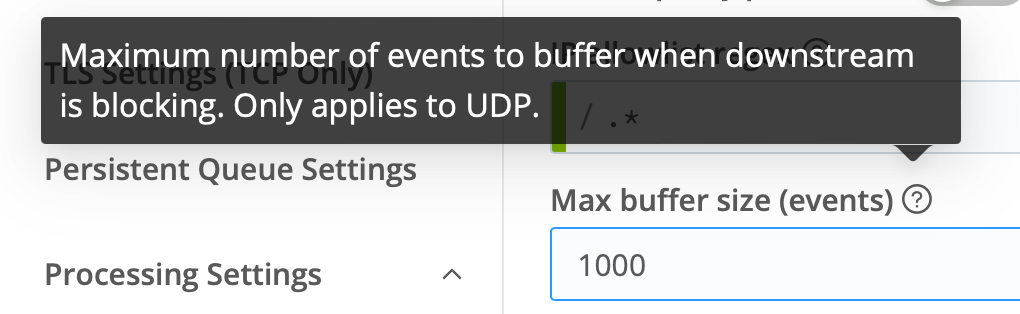
TIP: If you’re enabling source PQ for a UDP syslog input, be sure to disable the event buffer under Advanced Settings. You don’t want both sPQ and event buffering active. Make this setting 0:
TIP: Use dedicated and fast storage for your PQ. Dedicated because you don’t want to impact other parts of your running system in the event the PQ fills. Fast because you don’t want to hold up processing either writing to, or reading from, storage.
Conclusion
Cribl Stream puts management of all your logging sources in one place, and this includes syslog. We offer a performant, flexible, and complete syslog service. Still, syslog has its quirks, and scaling it successfully can be a journey. Hopefully, with Cribl Stream and the tips above, your journey to syslog mastery will be more enjoyable.
We invite you to visit Cribl Sandboxes and Cribl University to explore more of the ways Cribl can help you get your logging estate under control.
Log happy and s/chaos/order/ig
Cribl, the Data Engine for IT and Security, empowers organizations to transform their data strategy. Customers use Cribl’s suite of products to collect, process, route, and analyze all IT and security data, delivering the flexibility, choice, and control required to adapt to their ever-changing needs.
We offer free training, certifications, and a free tier across our products. Our community Slack features Cribl engineers, partners, and customers who can answer your questions as you get started and continue to build and evolve. We also offer a variety of hands-on Sandboxes for those interested in how companies globally leverage our products for their data challenges.